| |||||||||||||||||||||||||||||||||||||||||||||||||||||||||||||||||||||||
AMAZON.COM ANNOUNCES 28% SALES GROWTH FUELED BY LOWER PRICES AND FREE SHIPPING Meaningful Innovation Leads, Launches, Inspires Relentless Amazon Visitor Improvements SEATTLE--(BUSINESS WIRE)--April 24, 2003--Amazon.com, Inc. (NASDAQ: AMZN) today announced financial results for its first quarter ended March 31, 2003. Operating cash flow was $164 million for the trailing four quarters, compared with $46 million for the four quarters ended March 31, 2002. Free cash flow was $123 million for the trailing four quarters, compared with $10 million for the four quarters ended March 31, 2002. Common shares outstanding plus shares underlying stock-based employee awards totaled 432 million at March 31, 2003, a decrease of 1% compared with a year ago. Net sales were $1.084 billion in the first quarter, compared with $847 million in the first quarter 2002, an increase of 28%. Net loss was $10 million, or $(0.03) per share, in the first quarter, compared with $23 million in the first quarter 2002, or $(0.06) per share. Pro forma net income in the first quarter, which includes interest expense, grew over $45 million to $40 million, or $0.10 per share, compared with a pro forma net loss of $5 million, or $(0.01) per share, in the first quarter 2002. "Our strategy of driving down costs to give customers lower prices continues to pay off," said Tom Szkutak, chief financial officer of Amazon.com. "In the first quarter, customers took advantage of Free Super Saver Shipping and broad everyday low prices, which created our first-ever non-holiday quarter with sales over $1 billion, but this was only possible because we reduced our costs in virtually every area of our business." In addition to its year-round Free Super Saver Shipping on orders over $25 at www.amazon.com, the Company offers free shipping options at its U.K., German, French, Japanese and Canadian sites. Amazon.com also offers 30% off books over $15 and significantly lowered prices on electronics, tools, and bestselling CDs and DVDs. "Meaningful innovation leads, launches, inspires relentless Amazon visitor improvements," said Jeff Bezos, founder and chief executive officer of Amazon.com. "We are simultaneously lowering prices and driving customer experience." The company also announced that on May 28, 2003, it will redeem all of its outstanding 10% Senior Discount Notes due May 2008, for $277 million, a redemption price of 105% of the $264 million principal amount. See "Financial Measures" for additional information about certain of our financial measures. Highlights of First Quarter 2003 Results (comparisons are with the equivalent period of 2002)
| |||||||||||||||||||||||||||||||||||||||||||||||||||||||||||||||||||||||
 | |||||||||||||||||||||||||||||||||||||||||||||||||||||||||||||||||||||||
 | |||||||||||||||||||||||||||||||||||||||||||||||||||||||||||||||||||||||
 | |||||||||||||||||||||||||||||||||||||||||||||||||||||||||||||||||||||||
 | |||||||||||||||||||||||||||||||||||||||||||||||||||||||||||||||||||||||
 | |||||||||||||||||||||||||||||||||||||||||||||||||||||||||||||||||||||||
| | |||||||||||||||||||||||||||||||||||||||||||||||||||||||||||||||||||||||
 | |||||||||||||||||||||||||||||||||||||||||||||||||||||||||||||||||||||||
 | |||||||||||||||||||||||||||||||||||||||||||||||||||||||||||||||||||||||
| | |||||||||||||||||||||||||||||||||||||||||||||||||||||||||||||||||||||||
 | |||||||||||||||||||||||||||||||||||||||||||||||||||||||||||||||||||||||
 | |||||||||||||||||||||||||||||||||||||||||||||||||||||||||||||||||||||||
 | |||||||||||||||||||||||||||||||||||||||||||||||||||||||||||||||||||||||
 | |||||||||||||||||||||||||||||||||||||||||||||||||||||||||||||||||||||||
AMAZON.COM, INC. Financial and Operational Highlights (unaudited) First Quarter 2003 Results of Operations (comparisons are with the equivalent period of the prior year) Net Sales
Gross Profit
Fulfillment
Stock-Based Compensation
Restructuring-Related and Other
Other Income, Net
Remeasurement of 6.875% PEACS and Other
Income Taxes
Net Loss
Financial Condition
Certain Definitions and Other
| |||||||||||||||||||||||||||||||||||||||||||||||||||||||||||||||||||||||
| Back to top of Page | |||||||||||||||||||||||||||||||||||||||||||||||||||||||||||||||||||||||
SEATTLE--(BUSINESS WIRE)--April 24, 2003-- Meaningful Innovation Leads, Launches, Inspires Relentless Amazon Visitor Improvements
Amazon.com, Inc. (Nasdaq:AMZN) today announced financial results for its first quarter ended March 31, 2003.
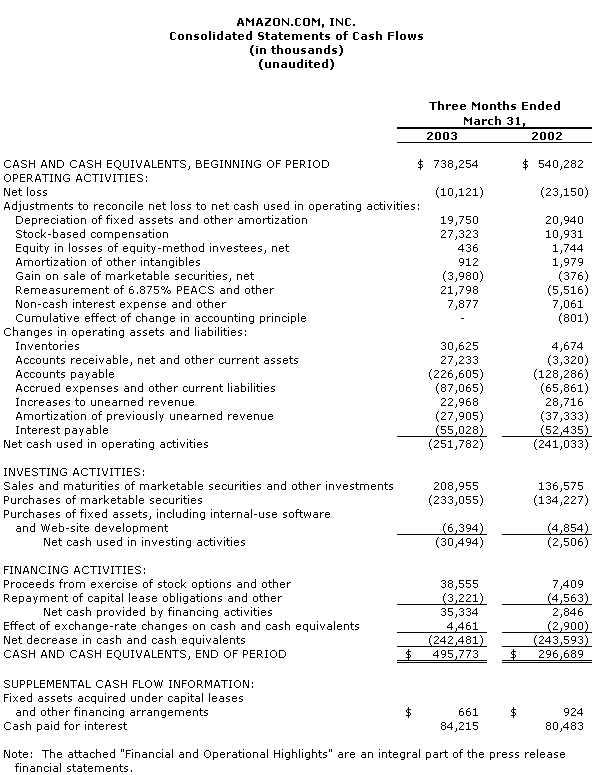
Operating cash flow was $164 million for the trailing four quarters, compared with $46 million for the four quarters ended March 31, 2002. Free cash flow was $123 million for the trailing four quarters, compared with $10 million for the four quarters ended March 31, 2002.
Common shares outstanding plus shares underlying stock-based employee awards totaled 432 million at March 31, 2003, a decrease of 1% compared with a year ago.
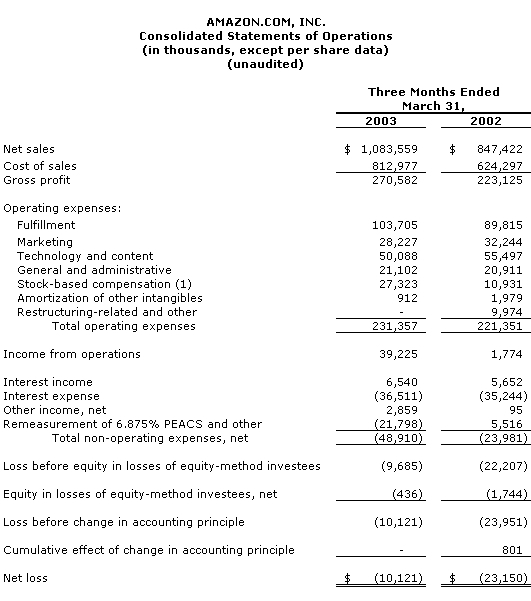
Net sales were $1.084 billion in the first quarter, compared with $847 million in the first quarter 2002, an increase of 28%.
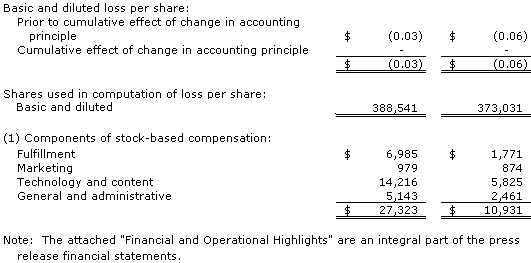
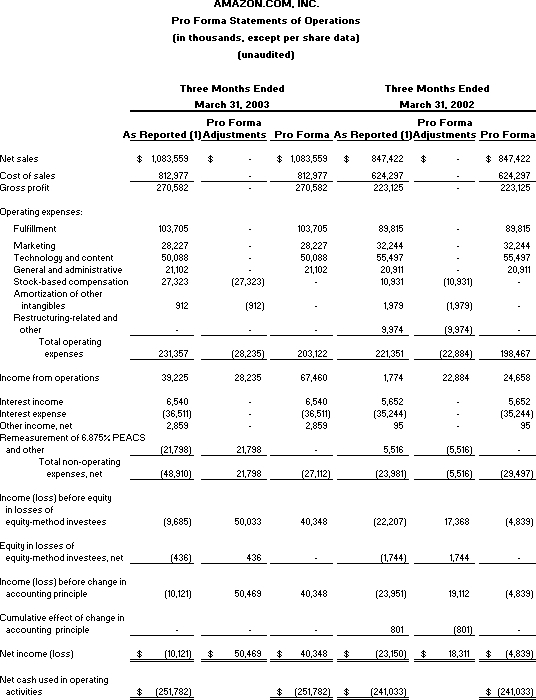
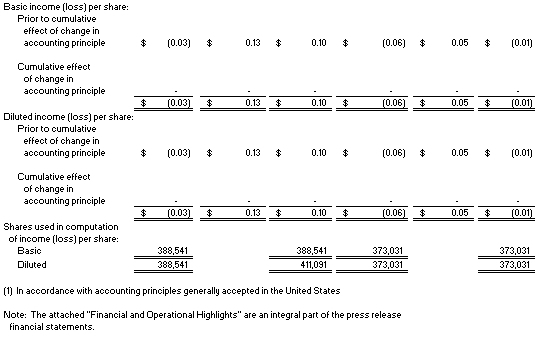
Net loss was $10 million, or $(0.03) per share, in the first quarter, compared with $23 million in the first quarter 2002, or $(0.06) per share. Pro forma net income in the first quarter, which includes interest expense, grew over $45 million to $40 million, or $0.10 per share, compared with a pro forma net loss of $5 million, or $(0.01) per share, in the first quarter 2002.
"Our strategy of driving down costs to give customers lower prices continues to pay off," said Tom Szkutak, chief financial officer of Amazon.com. "In the first quarter, customers took advantage of Free Super Saver Shipping and broad everyday low prices, which created our first-ever non-holiday quarter with sales over $1 billion, but this was only possible because we reduced our costs in virtually every area of our business."
In addition to its year-round Free Super Saver Shipping on orders over $25 at www.amazon.com, the Company offers free shipping options at its U.K., German, French, Japanese and Canadian sites. Amazon.com also offers 30% off books over $15 and significantly lowered prices on electronics, tools, and bestselling CDs and DVDs.
"Meaningful innovation leads, launches, inspires relentless Amazon visitor improvements," said Jeff Bezos, founder and chief executive officer of Amazon.com. "We are simultaneously lowering prices and driving customer experience."
The Company also announced that on May 28, 2003, it will redeem all of its outstanding 10% Senior Discount Notes due May 2008, for $277 million, a redemption price of 105% of the $264 million principal amount.
See "Financial Measures" for additional information about certain of our financial measures.
Highlights of First Quarter 2003 Results (comparisons are with the equivalent period of 2002)
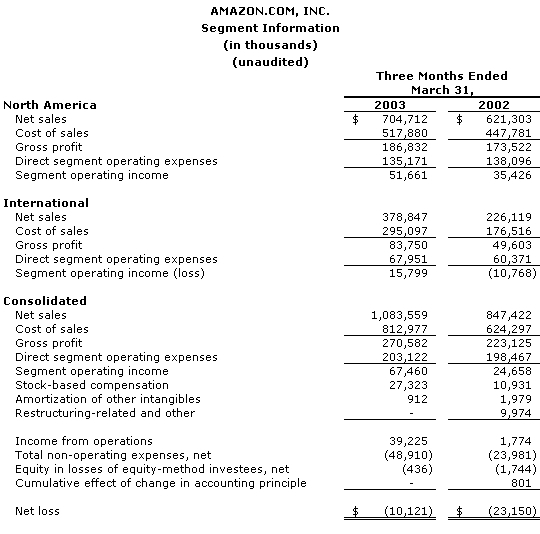
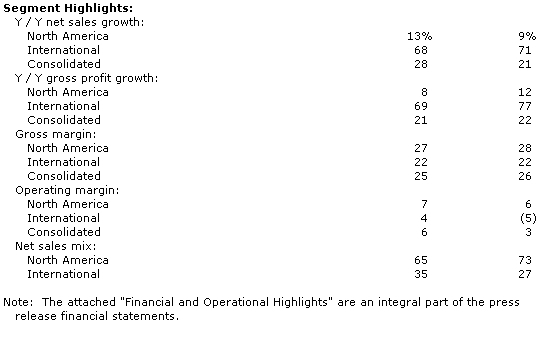
-- Worldwide unit growth was 35% in the first quarter. -- Third-party seller transactions (new, used and refurbished items sold on Amazon.com product detail pages by businesses and individuals) grew to 19% of worldwide units in the first quarter, compared with 13% of units a year ago. -- North America segment sales grew 13% to $705 million in the first quarter, unit growth was 28%, and segment operating income grew 46% to $52 million. -- International segment sales, representing the Company's U.K., German, French and Japanese sites, grew 68% to $379 million in the first quarter, unit growth was 52%, and excluding the benefit from foreign exchange rates compared with the first quarter 2002, International segment sales grew 45%. International segment operating income was $16 million, a $27 million improvement. -- The Company's U.K. and German sites expanded selection by opening Kitchen & Home stores. -- Inventory turns for the trailing four quarters improved to 20 for the first quarter, up from 17. -- The Company has been taking pre-orders worldwide for copies of the highly-anticipated Harry Potter and the Order of the Phoenix. And, in what will be the largest single e-commerce distribution event in history, customers in the U.S. and Canada can receive their copy on Saturday, June 21, the first day the book is available to the public. Financial Guidance and 2003 Expectations
The following forward-looking statements reflect Amazon.com's expectations as of April 24, 2003. Results may be materially affected by many factors, such as changes in global economic conditions and consumer spending, world events, fluctuations in foreign exchange rates, the emerging nature and rate of growth of the Internet and online commerce, and the various factors detailed below.
Second Quarter 2003 Guidance -- Second quarter net sales are expected to be between $1.00 billion and $1.05 billion, or grow between 24% and 30%. -- Consolidated segment operating income is expected to be between $45 million and $60 million. Full Year 2003 Expectations -- Net sales are expected to be $4.7 billion or more, or grow over 19%. -- Consolidated segment operating income is expected to be $275 million or more, or grow over 50%.
The Company is unable to forecast the effect on its future reported results of certain items, including the stock-based compensation charges or credits associated with variable accounting treatment on certain stock awards that result from fluctuations in its stock price, and the gain or loss associated with the remeasurement of its 6.875% PEACS that results from fluctuations in foreign exchange rates. Accordingly, because stock-based compensation and remeasurement of 6.875% PEACS and other are impossible to predict, the Company cannot estimate future operating income (loss) or net income (loss).
A conference call will be Webcast live today at 2 p.m. PT/5 p.m. ET and will be available through June 30, 2003, at www.amazon.com/ir. This call will contain forward-looking statements and other material information regarding the Company's financial and operating results.
These forward-looking statements are inherently difficult to predict. Actual results could differ materially for a variety of reasons, including, among others, the rate of growth of the economy in general and of the Internet and online commerce; customer spending patterns; world events, the amount that Amazon.com invests in new business opportunities and the timing of those investments; the mix of products sold to customers; the mix of net sales derived from products as compared with services; competition; risks of inventory management; the degree to which the Company enters into, maintains and develops commercial agreements and strategic transactions; foreign exchange risks; seasonality; international growth and expansion; and risks of fulfillment throughput and productivity. Other risks and uncertainties include, among others, risk of future losses, significant amount of indebtedness, potential fluctuations in operating results, management of potential growth, system interruptions, consumer trends, fulfillment center optimization, limited operating history, government regulation and taxation, fraud and new business areas. More information about factors that potentially could affect Amazon.com's financial results is included in Amazon.com's filings with the Securities and Exchange Commission, including its Annual Report on Form 10-K for the year ended December 31, 2002, and all subsequent filings.
Financial Measures Free Cash Flow
Free cash flow is net cash provided by (used in) operating activities (operating cash flow includes cash outflows for interest and excludes proceeds from the exercise of stock-based employee awards) less purchases of fixed assets (purchases of fixed assets includes internal-use software and web-site development). Free cash flow is provided as a complement to results provided in accordance with accounting principles generally accepted in the United States (known as "GAAP"). Management uses this measure internally to evaluate the Company's performance and manage its operations. A tabular reconciliation of differences from the comparable GAAP measure--operating cash flow--is included in the attached "Supplemental Financial Information and Business Metrics."
Consolidated Segment Operating Income
Consolidated segment operating income, a GAAP measure, excludes the following line items on the Company's statements of operations:
-- Stock-based compensation, -- Amortization of goodwill and other intangibles, and -- Restructuring-related and other.
A tabular reconciliation of differences from operating income is included in "Segment Information" in the attached financial statements.
Pro Forma Net Income (Loss)
Pro forma net income (loss) excludes the following line items on the Company's statements of operations:
-- Stock-based compensation, -- Amortization of goodwill and other intangibles, -- Restructuring-related and other, -- Remeasurement of 6.875% PEACS and other, -- Equity in losses of equity-method investees, net, and -- Cumulative effect of change in accounting principle.
Pro forma net income is provided as a complement to results provided in accordance with GAAP. Management uses this measure internally to evaluate the Company's performance and manage its operations. A tabular reconciliation of differences from the comparable GAAP measure -- net income (loss) -- is included in the attached "Pro Forma Statements of Operations."
About Amazon.com
Amazon.com, a Fortune 500 company based in Seattle, opened on the World Wide Web in July 1995 and today offers Earth's Biggest Selection. Amazon.com seeks to be Earth's most customer-centric company, where customers can find and discover anything they might want to buy online, and endeavors to offer its customers the lowest possible prices. Amazon.com and other sellers list millions of unique new and used items in categories such as apparel and accessories, electronics, computers, kitchenware and housewares, books, music, DVDs, videos, cameras and photo items, toys, baby items and baby registry, software, computer and video games, cell phones and service, tools and hardware, magazine subscriptions and outdoor living items.
Amazon.com operates six Web sites: www.amazon.com, www.amazon.co.uk, www.amazon.de, www.amazon.fr, www.amazon.co.jp and www.amazon.ca.
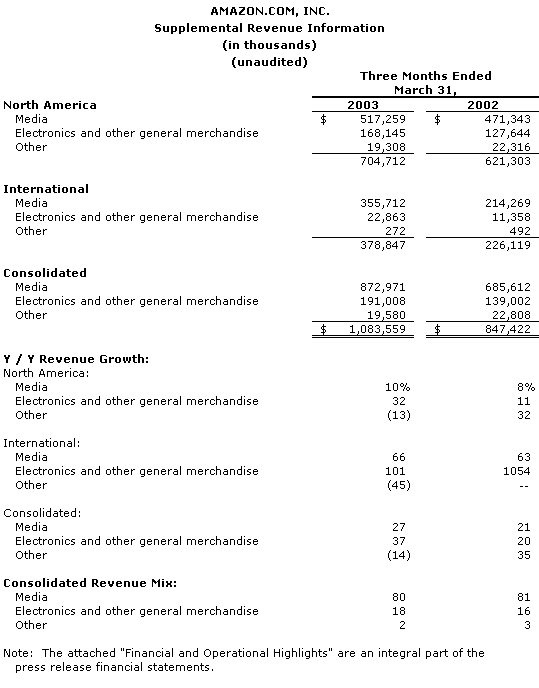
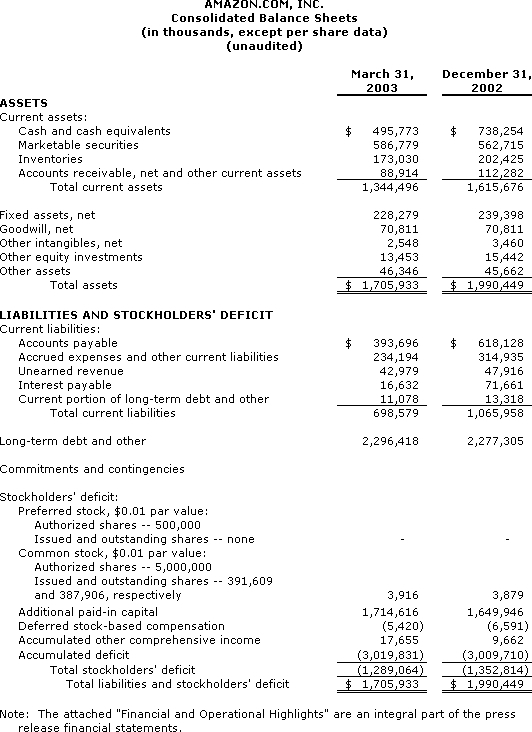
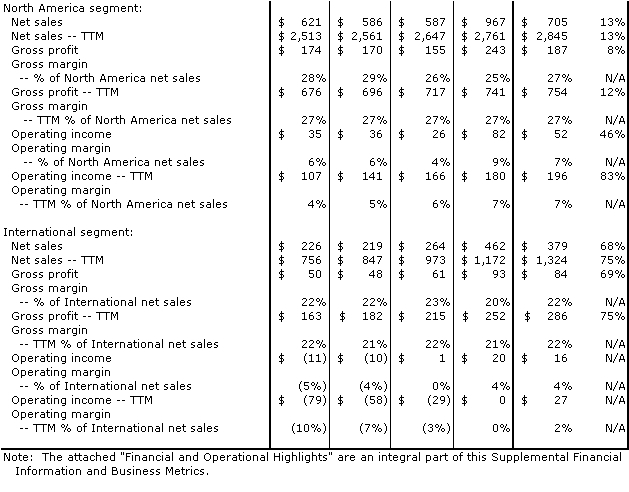
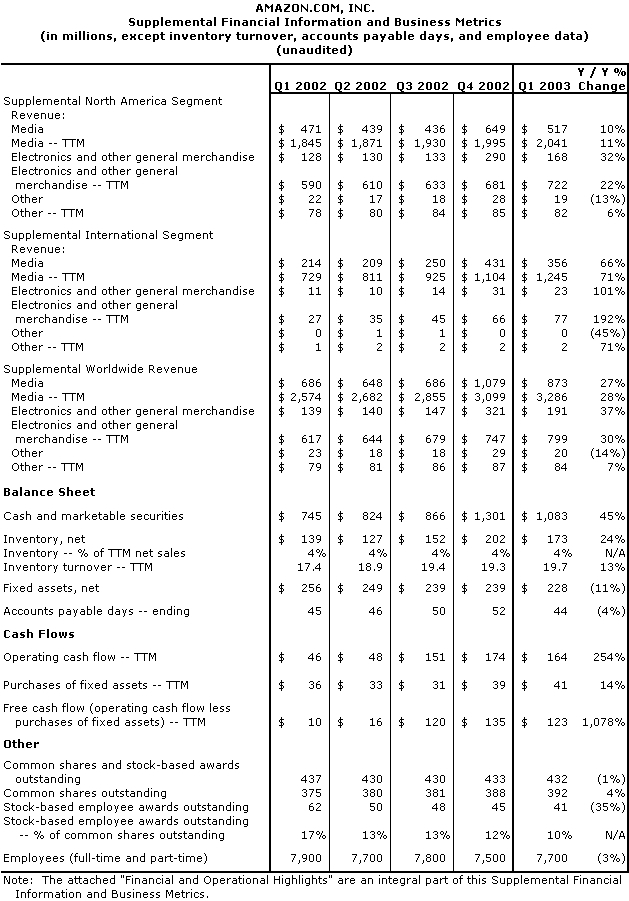
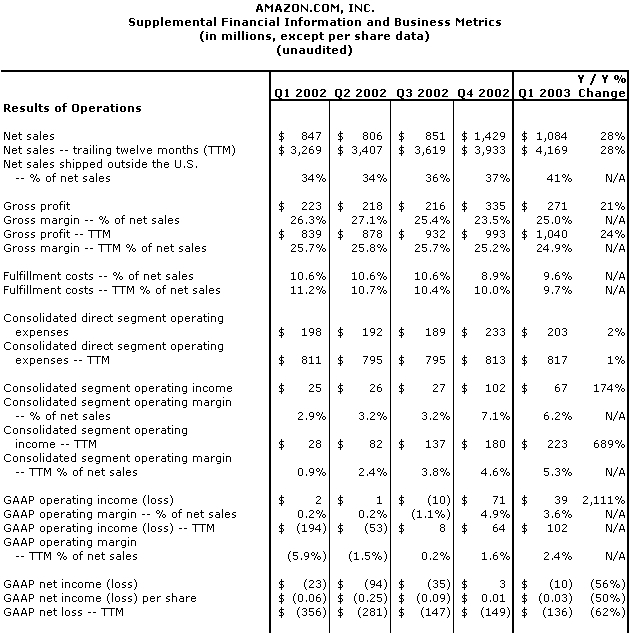
AMAZON.COM, INC. Consolidated Statements of Cash Flows (in thousands) (unaudited) Three Months Ended March 31, 2003 2002 -------- --------CASH AND CASH EQUIVALENTS, BEGINNING OF PERIOD $738,254 $540,282OPERATING ACTIVITIES:Net loss (10,121) (23,150)Adjustments to reconcile net loss to net cash used in operating activities: Depreciation of fixed assets and other amortization 19,750 20,940 Stock-based compensation 27,323 10,931 Equity in losses of equity-method investees, net 436 1,744 Amortization of other intangibles 912 1,979 Gain on sale of marketable securities, net (3,980) (376) Remeasurement of 6.875% PEACS and other 21,798 (5,516) Non-cash interest expense and other 7,877 7,061 Cumulative effect of change in accounting principle - (801)Changes in operating assets and liabilities: Inventories 30,625 4,674 Accounts receivable, net and other current assets 27,233 (3,320) Accounts payable (226,605) (128,286) Accrued expenses and other current liabilities (87,065) (65,861) Increases to unearned revenue 22,968 28,716 Amortization of previously unearned revenue (27,905) (37,333) Interest payable (55,028) (52,435) -------- --------Net cash used in operating activities (251,782) (241,033)INVESTING ACTIVITIES:Sales and maturities of marketable securities and other investments 208,955 136,575Purchases of marketable securities (233,055) (134,227)Purchases of fixed assets, including internal-use software and Web-site development (6,394) (4,854) -------- -------- Net cash used in investing activities (30,494) (2,506)FINANCING ACTIVITIES:Proceeds from exercise of stock options and other 38,555 7,409Repayment of capital lease obligations and other (3,221) (4,563) -------- -------- Net cash provided by financing activities 35,334 2,846Effect of exchange-rate changes on cash and cash equivalents 4,461 (2,900) -------- --------Net decrease in cash and cash equivalents (242,481) (243,593) -------- --------CASH AND CASH EQUIVALENTS, END OF PERIOD $495,773 $296,689 ======== ========SUPPLEMENTAL CASH FLOW INFORMATION:Fixed assets acquired under capital leases and other financing arrangements $661 $924Cash paid for interest 84,215 80,483Note: The attached "Financial and Operational Highlights" are anintegral part of the press release financial statements. AMAZON.COM, INC. Consolidated Statements of Operations (in thousands, except per share data) (unaudited) Three Months Ended March 31, 2003 2002 -------- --------Net sales $1,083,559 $847,422Cost of sales 812,977 624,297 ---------- --------Gross profit 270,582 223,125Operating expenses: Fulfillment 103,705 89,815 Marketing 28,227 32,244 Technology and content 50,088 55,497 General and administrative 21,102 20,911 Stock-based compensation (1) 27,323 10,931 Amortization of other intangibles 912 1,979 Restructuring-related and other - 9,974 ---------- -------- Total operating expenses 231,357 221,351 ---------- --------Income from operations 39,225 1,774Interest income 6,540 5,652Interest expense (36,511) (35,244)Other income, net 2,859 95Remeasurement of 6.875% PEACS and other (21,798) 5,516 ---------- -------- Total non-operating expenses, net (48,910) (23,981) ---------- --------Loss before equity in losses of equity-method investees (9,685) (22,207)Equity in losses of equity-method investees, net (436) (1,744) ---------- --------Loss before change in accounting principle (10,121) (23,951)Cumulative effect of change in accounting principle - 801 ---------- --------Net loss $(10,121) $(23,150) =========== =========Basic and diluted loss per share: Prior to cumulative effect of change in accounting principle $(0.03) $(0.06) Cumulative effect of change in accounting principle - - ---------- -------- $(0.03) $(0.06) =========== =========Shares used in computation of loss per share: Basic and diluted 388,541 373,031 =========== =========(1) Components of stock-based compensation: Fulfillment $6,985 $1,771 Marketing 979 874 Technology and content 14,216 5,825 General and administrative 5,143 2,461 ---------- -------- $27,323 $10,931 =========== =========Note: The attached "Financial and Operational Highlights" are anintegral part of the press release financial statements. AMAZON.COM, INC. Pro Forma Statements of Operations (in thousands, except per share data) (unaudited) Three Months Ended March 31, 2003 --------------------------------------- As Reported Pro Forma (1) Adjustments Pro Forma ---------- ----------- ----------Net sales $1,083,559 $- $1,083,559Cost of sales 812,977 - 812,977 ---------- ---------- ----------Gross profit 270,582 - 270,582Operating expenses: Fulfillment 103,705 - 103,705 Marketing 28,227 - 28,227 Technology and content 50,088 - 50,088 General and administrative 21,102 - 21,102 Stock-based compensation 27,323 (27,323) - Amortization of other intangibles 912 (912) - Restructuring- related and other - - - ---------- ---------- ---------- Total operating expenses 231,357 (28,235) 203,122 ---------- ---------- ----------Income from operations 39,225 28,235 67,460Interest income 6,540 - 6,540Interest expense (36,511) - (36,511)Other income, net 2,859 - 2,859Remeasurement of 6.875% PEACS and other (21,798) 21,798 - ---------- ---------- ---------- Total non-operating expenses, net (48,910) 21,798 (27,112) ---------- ---------- ----------Income (loss) before equity in losses of equity-method investees (9,685) 50,033 40,348Equity in losses of equity-method investees, net (436) 436 - ---------- ---------- ----------Income (loss) before change in accounting principle (10,121) 50,469 40,348Cumulative effect of change in accounting principle - - - ---------- ----------- -----------Net income (loss) $(10,121) $50,469 $40,348 =========== =========== ===========Net cash used in operating activities $(251,782) $(251,782) =========== ===========Basic income (loss) per share: Prior to cumulative effect of change in accounting principle $(0.03) $0.13 $0.10 Cumulative effect of change in accounting principle - - - ---------- ----------- ----------- $(0.03) $0.13 $0.10 =========== =========== ===========Diluted income (loss) per share: Prior to cumulative effect of change in accounting principle $(0.03) $0.13 $0.10 Cumulative effect of change in accounting principle - - - ---------- ---------- ---------- $(0.03) $0.13 $0.10 =========== ======== ===========Shares used in computation of income (loss) per share: Basic 388,541 388,541 =========== =========== Diluted 388,541 411,091 =========== =========== (1) In accordance with accounting principles generally accepted inthe United States.Note: The attached "Financial and Operational Highlights" are an integral part of the press release financial statements. Three Months Ended March 31, 2002 ----------------------------------- As Reported Pro Forma (1) Adjustments Pro Forma ---------- ----------- ---------Net sales $847,422 $- $847,422Cost of sales 624,297 - 624,297 -------- -------- --------Gross profit 223,125 - 223,125Operating expenses: Fulfillment 89,815 - 89,815 Marketing 32,244 - 32,244 Technology and content 55,497 - 55,497 General and administrative 20,911 - 20,911 Stock-based compensation 10,931 (10,931) - Amortization of other intangibles 1,979 (1,979) - Restructuring-related and other 9,974 (9,974) - -------- -------- -------- Total operating expenses 221,351 (22,884) 198,467 -------- -------- --------Income from operations 1,774 22,884 24,658Interest income 5,652 - 5,652Interest expense (35,244) - (35,244)Other income, net 95 - 95Remeasurement of 6.875% PEACS and other 5,516 (5,516) - -------- -------- -------- Total non-operating expenses, net (23,981) (5,516) (29,497) -------- -------- --------Income (loss) before equity in losses of equity-method investees (22,207) 17,368 (4,839)Equity in losses of equity- method investees, net (1,744) 1,744 - -------- -------- --------Income (loss) before change in accounting principle (23,951) 19,112 (4,839)Cumulative effect of change in accounting principle 801 (801) - -------- -------- --------Net income (loss) $(23,150) $18,311 $(4,839) =========== ======== ===========Net cash used in operating activities $(241,033) $(241,033) =========== ===========Basic income (loss) per share: Prior to cumulative effect of change in accounting principle $(0.06) $0.05 $(0.01) Cumulative effect of change in accounting principle - - - ----------- -------- ---------- $(0.06) $0.05 $(0.01) =========== ======== ==========Diluted income (loss) per share: Prior to cumulative effect of change in accounting principle $(0.06) $0.05 $(0.01) Cumulative effect of change in accounting principle - - - ----------- -------- ---------- $(0.06) $0.05 $(0.01) =========== ======== ==========Shares used in computation of income (loss) per share: Basic 373,031 373,031 =========== ========== Diluted 373,031 373,031 =========== ========== (1) In accordance with accounting principles generally accepted inthe United States.Note: The attached "Financial and Operational Highlights" are an integral part of the press release financial statements. AMAZON.COM, INC. Segment Information (in thousands) (unaudited) Three Months Ended March 31, ------------------ 2003 2002North America -------- -------- Net sales $704,712 $621,303 Cost of sales 517,880 447,781 -------- -------- Gross profit 186,832 173,522 Direct segment operating expenses 135,171 138,096 -------- -------- Segment operating income 51,661 35,426International Net sales 378,847 226,119 Cost of sales 295,097 176,516 -------- -------- Gross profit 83,750 49,603 Direct segment operating expenses 67,951 60,371 -------- -------- Segment operating income (loss) 15,799 (10,768)Consolidated Net sales 1,083,559 847,422 Cost of sales 812,977 624,297 -------- -------- Gross profit 270,582 223,125 Direct segment operating expenses 203,122 198,467 -------- -------- Segment operating income 67,460 24,658 Stock-based compensation 27,323 10,931 Amortization of other intangibles 912 1,979 Restructuring-related and other - 9,974 -------- -------- Income from operations 39,225 1,774 Total non-operating expenses, net (48,910) (23,981) Equity in losses of equity-method investees, net (436) (1,744) Cumulative effect of change in accounting principle - 801 -------- -------- Net loss $(10,121) $(23,150) ======== ========Segment Highlights: Y / Y net sales growth: North America 13% 9% International 68 71 Consolidated 28 21 Y / Y gross profit growth: North America 8 12 International 69 77 Consolidated 21 22 Gross margin: North America 27 28 International 22 22 Consolidated 25 26 Operating margin: North America 7 6 International 4 (5) Consolidated 6 3 Net sales mix: North America 65 73 International 35 27Note: The attached "Financial and Operational Highlights" are an integral part of the press release financial statements. AMAZON.COM, INC. Supplemental Revenue Information (in thousands) (unaudited) Three Months Ended March 31, ------------------ 2003 2002 -------- --------North America Media $517,259 $471,343 Electronics and other general merchandise 168,145 127,644 Other 19,308 22,316 -------- -------- 704,712 621,303International Media 355,712 214,269 Electronics and other general merchandise 22,863 11,358 Other 272 492 -------- -------- 378,847 226,119Consolidated Media 872,971 685,612 Electronics and other general merchandise 191,008 139,002 Other 19,580 22,808 ----------- --------- $1,083,559 $847,422 =========== =========Y / Y Revenue Growth:North America: Media 10% 8% Electronics and other general merchandise 32 11 Other (13) 32International: Media 66 63 Electronics and other general merchandise 101 1,054 Other (45) --Consolidated: Media 27 21 Electronics and other general merchandise 37 20 Other (14) 35Consolidated Revenue Mix: Media 80 81 Electronics and other general merchandise 18 16 Other 2 3Note: The attached "Financial and Operational Highlights" are an integral part of the press release financial statements. AMAZON.COM, INC. Consolidated Balance Sheets (in thousands, except per share data) (unaudited) March December 31, 31, 2003 2002 --------- --------ASSETSCurrent assets: Cash and cash equivalents $495,773 $738,254 Marketable securities 586,779 562,715 Inventories 173,030 202,425 Accounts receivable, net and other current assets 88,914 112,282 --------- -------- Total current assets 1,344,496 1,615,676Fixed assets, net 228,279 239,398Goodwill, net 70,811 70,811Other intangibles, net 2,548 3,460Other equity investments 13,453 15,442Other assets 46,346 45,662 ---------- ---------- Total assets $1,705,933 $1,990,449 ========== ==========LIABILITIES AND STOCKHOLDERS' DEFICITCurrent liabilities: Accounts payable $393,696 $618,128 Accrued expenses and other current liabilities 234,194 314,935 Unearned revenue 42,979 47,916 Interest payable 16,632 71,661 Current portion of long-term debt and other 11,078 13,318 ---------- ---------- Total current liabilities 698,579 1,065,958Long-term debt and other 2,296,418 2,277,305Commitments and contingenciesStockholders' deficit: Preferred stock, $0.01 par value: Authorized shares -- 500,000 Issued and outstanding shares -- none - - Common stock, $0.01 par value: Authorized shares -- 5,000,000 Issued and outstanding shares -- 391,609 and 387,906, respectively 3,916 3,879 Additional paid-in capital 1,714,616 1,649,946 Deferred stock-based compensation (5,420) (6,591) Accumulated other comprehensive income 17,655 9,662 Accumulated deficit (3,019,831) (3,009,710) ---------- ---------- Total stockholders' deficit (1,289,064) (1,352,814) ---------- ---------- Total liabilities and stockholders' deficit $1,705,933 $1,990,449 =========== ===========Note: The attached "Financial and Operational Highlights" are an integral part of the press release financial statements. AMAZON.COM, INC. Supplemental Financial Information and Business Metrics (in millions, except per share data) (unaudited) Y / Y Q1 Q2 Q3 Q4 Q1 % 2002 2002 2002 2002 2003 Change ------ ----- ----- ----- ----- ------Results of OperationsNet sales $847 $806 $851 $1,429 $1,084 28%Net sales -- trailing twelve months (TTM) $3,269 $3,407 $3,619 $3,933 $4,169 28%Net sales shipped outside the U.S. -- % of net sales 34% 34% 36% 37% 41% N/AGross profit $223 $218 $216 $335 $271 21%Gross margin -- % of net sales 26.3% 27.1% 25.4% 23.5% 25.0% N/AGross profit -- TTM $839 $878 $932 $993 $1,040 24%Gross margin -- TTM % of net sales 25.7% 25.8% 25.7% 25.2% 24.9% N/AFulfillment costs -- % of net sales 10.6% 10.6% 10.6% 8.9% 9.6% N/AFulfillment costs -- TTM % of net sales 11.2% 10.7% 10.4% 10.0% 9.7% N/AConsolidated direct segment operating expenses $198 $192 $189 $233 $203 2%Consolidated direct segment operating expenses -- TTM $811 $795 $795 $813 $817 1%Consolidated segment operating income $25 $26 $27 $102 $67 174%Consolidated segment operating margin -- % of net sales 2.9% 3.2% 3.2% 7.1% 6.2% N/AConsolidated segment operating income -- TTM $28 $82 $137 $180 $223 689%Consolidated segment operating margin -- TTM % of net sales 0.9% 2.4% 3.8% 4.6% 5.3% N/AGAAP operating income (loss) $2 $1 $(10) $71 $39 2,111%GAAP operating margin -- % of net sales 0.2% 0.2% (1.1%) 4.9% 3.6% N/AGAAP operating income (loss) -- TTM $(194) $(53) $8 $64 $102 N/AGAAP operating margin -- TTM % of net sales (5.9%) (1.5%) 0.2% 1.6% 2.4% N/AGAAP net income (loss) $(23) $(94) $(35) $3 $(10) (56%)GAAP net income (loss) per share $(0.06)$(0.25)$(0.09) $0.01 $(0.03) (50%)GAAP net loss -- TTM $(356) $(281) $(147) $(149) $(136) (62%)North America segment: Net sales $621 $586 $587 $967 $705 13% Net sales -- TTM $2,513 $2,561 $2,647 $2,761 $2,845 13% Gross profit $174 $170 $155 $243 $187 8% Gross margin -- % of North America net sales 28% 29% 26% 25% 27% N/A Gross profit -- TTM $676 $696 $717 $741 $754 12% Gross margin -- TTM % of North America net sales 27% 27% 27% 27% 27% N/A Operating income $35 $36 $26 $82 $52 46% Operating margin -- % of North America net sales 6% 6% 4% 9% 7% N/A Operating income -- TTM $107 $141 $166 $180 $196 83% Operating margin -- TTM % of North America net sales 4% 5% 6% 7% 7% N/AInternational segment: Net sales $226 $219 $264 $462 $379 68% Net sales -- TTM $756 $847 $973 $1,172 $1,324 75% Gross profit $50 $48 $61 $93 $84 69% Gross margin -- % of International net sales 22% 22% 23% 20% 22% N/A Gross profit -- TTM $163 $182 $215 $252 $286 75% Gross margin -- TTM % of International net sales 22% 21% 22% 21% 22% N/A Operating income $(11) $(10) $1 $20 $16 N/A Operating margin -- % of International net sales (5%) (4%) 0% 4% 4% N/A Operating income -- TTM $(79) $(58) $(29) $0 $27 N/A Operating margin -- TTM % of International net sales (10%) (7%) (3%) 0% 2% N/ANote: The attached "Financial and Operational Highlights" are an integral part of this Supplemental Financial Information and Business Metrics. AMAZON.COM, INC. Supplemental Financial Information and Business Metrics (in millions, except inventory turnover, accounts payable days, and employee data) (unaudited) Y / Y Q1 Q2 Q3 Q4 Q1 % 2002 2002 2002 2002 2003 Change ------ ----- ----- ----- ----- ------Supplemental North America Segment Revenue: Media $471 $439 $436 $649 $517 10% Media -- TTM $1,845 $1,871 $1,930 $1,995 $2,041 11% Electronics and other general merchandise $128 $130 $133 $290 $168 32% Electronics and other general merchandise -- TTM $590 $610 $633 $681 $722 22% Other $22 $17 $18 $28 $19 (13%) Other -- TTM $78 $80 $84 $85 $82 6%Supplemental International Segment Revenue: Media $214 $209 $250 $431 $356 66% Media -- TTM $729 $811 $925 $1,104 $1,245 71% Electronics and other general merchandise $11 $10 $14 $31 $23 101% Electronics and other general merchandise -- TTM $27 $35 $45 $66 $77 192% Other $0 $1 $1 $0 $0 (45%) Other -- TTM $1 $2 $2 $2 $2 71%Supplemental Worldwide Revenue: Media $686 $648 $686 $1,079 $873 27% Media -- TTM $2,574 $2,682 $2,855 $3,099 $3,286 28% Electronics and other general merchandise $139 $140 $147 $321 $191 37% Electronics and other general merchandise -- TTM $617 $644 $679 $747 $799 30% Other $23 $18 $18 $29 $20 (14%) Other -- TTM $79 $81 $86 $87 $84 7%Balance SheetCash and marketable securities $745 $824 $866 $1,301 $1,083 45%Inventory, net $139 $127 $152 $202 $173 24%Inventory -- % of TTM net sales 4% 4% 4% 4% 4% N/AInventory turnover -- TTM 17.4 18.9 19.4 19.3 19.7 13%Fixed assets, net $256 $249 $239 $239 $228 (11%)Accounts payable days -- ending 45 46 50 52 44 (4%)Cash FlowsOperating cash flow -- TTM $46 $48 $151 $174 $164 254%Purchases of fixed assets -- TTM $36 $33 $31 $39 $41 14%Free cash flow (operating cash flow less purchases of fixed assets) -- TTM $10 $16 $120 $135 $123 1,078%OtherCommon shares and stock-based awards outstanding 437 430 430 433 432 (1%)Common shares outstanding 375 380 381 388 392 4%Stock-based employee awards outstanding 62 50 48 45 41 (35%)Stock-based employee awards outstanding -- % of common shares outstanding 17% 13% 13% 12% 10% N/AEmployees (full-time and part-time) 7,900 7,700 7,800 7,500 7,700 (3%)Note: The attached "Financial and Operational Highlights" are an integral part of this Supplemental Financial Information and Business Metrics. AMAZON.COM, INC. Financial and Operational Highlights (unaudited)
First Quarter 2003 Results of Operations (comparisons are with the equivalent period of the prior year)
Net Sales -- Net sales benefited by approximately $51 million from changes in foreign exchange rates compared with first quarter 2002. -- Shipping revenue, which excludes amounts earned from third-party sellers, was approximately $78 million, down from $89 million. Gross Profit -- Gross profit benefited by approximately $11 million, and consolidated segment operating profit by approximately $4 million, from changes in foreign exchange rates compared with first quarter 2002. -- Shipping loss was approximately $27 million, up from a loss of $1 million. We continue to measure our shipping results relative to their effect on our overall financial results, with the viewpoint that shipping promotions are an effective marketing tool. We intend to continue offering our customers free shipping alternatives, which will reduce shipping revenue as a percentage of sales and negatively affect gross margins. Fulfillment -- Fulfillment costs represent those costs incurred in operating and staffing our fulfillment and customer service centers, credit card fees and bad debt costs. Fulfillment costs also include amounts paid to third-party cosourcers, who assist us in fulfillment and customer service operations. Certain of our fulfillment-related costs incurred on behalf of other businesses, such as Toysrus.com and Target Corporation, are classified as cost of sales rather than fulfillment. Stock-Based Compensation -- Stock based compensation consisted of $21 million for employee stock awards under variable accounting and $6 million for employee restricted stock units and restricted stock awards under fixed accounting. -- At March 31, 2003, outstanding stock awards consisted of 38 million stock options ($12 average exercise price), 3 million restricted stock units and 1 million shares of restricted stock. -- Stock options and restricted stock units are excluded from common stock outstanding, whereas grants of restricted stock are included in common stock outstanding. -- Under our restricted stock unit program, which commenced in the fourth quarter 2002, we award restricted stock units as our primary vehicle for equity compensation. Restricted stock units are measured at fair value on the date of grant based on the number of shares granted and the quoted price of our common stock. Such value is recognized as an expense over the corresponding service period. To the extent that restricted stock units are forfeited prior to vesting, the corresponding previously recognized expense is reversed as an offset to stock-based compensation. -- At March 31, 2003, 3 million stock awards are subject to variable accounting, of which 2 million options granted under the January 2001 exchange offer are scheduled to expire in the third quarter of 2003. Beginning in January 2003, any new stock option grants are subject to variable accounting treatment. -- Under variable stock option accounting, we will incur unpredictable charges or credits dependent on the fluctuations in market prices of our common stock, which we are unable to forecast. For example, if at the end of any quarter the quoted price of our common stock is lower than the quoted price at the end of the previous quarter, or to the extent previously-recorded amounts relate to unvested portions of options that were cancelled, compensation expense associated with variable accounting will be recalculated using the cumulative expense method and may result in a net benefit to our results of operations. -- Using the following hypothetical market prices of our common stock above and below our March 31, 2003 closing price of $26.03, our hypothetical stock-based compensation expense for the three months ended March 31, 2003 would have been affected by variable accounting treatment as follows (in millions, except percentages and per share amounts): Hypothetical vs. Hypothetical Hypothetical Actual Stock- Market Stock-Based Based Percentage Difference Price per Share Compensation Compensation Closing Price (1) (1) Expense Expense---------------------------------------------------------------------- (15)% $22.13 $19 $(8) (10)% 23.43 22 (6) 0 % 26.03 27(2) -- 10 % 28.63 33 6 15 % 29.93 36 8
-----------------
(1) Hypothetical--not a prediction of future performance of quoted prices of our common stock.
(2) Represents actual stock-based compensation expense for the first quarter 2003.
Restructuring-Related and Other -- As previously disclosed, in the first quarter 2001 we announced and began implementation of our operational restructuring plan. The restructuring plan is complete; however, we may adjust our restructuring-related estimates in the future, if necessary. -- Cash payments resulting from our operational restructuring were $16 million, compared with $14 million in the first quarter 2002. In December 2002, we reached a termination agreement with the landlord of our leased fulfillment center facility in McDonough, Georgia. This agreement resulted in $12 million of cash payments in the first quarter 2003, including $8 million associated with the termination agreement and $4 million associated with restoration costs. No further payments are required relating to the McDonough, Georgia facility. -- We estimate, based on currently available information, the remaining net cash outflows associated with restructuring-related leases and other commitments will be $9 million in the remainder of 2003, $13 million in 2004, and $19 million thereafter. Amounts due within 12 months are included within accrued expenses and other current liabilities and the remaining amounts within long-term debt and other on our balance sheet. These amounts are net of anticipated sublease income of approximately $47 million (we have signed sublease agreements on $10 million in future payments) on gross lease obligations of $87 million. Other Income, Net -- Other income, net primarily consisted of net gains on sales of marketable securities of $4 million, compared with less than $1 million in the first quarter 2002. Remeasurement of 6.875% PEACS and Other -- Remeasurement of 6.875% PEACS and other, primarily consisted of foreign-currency losses on remeasurement of 6.875% PEACS from Euros to U.S. Dollars of $25 million, compared with gains of $6 million in the first quarter 2002. Income Taxes -- At March 31, 2003, we had net operating loss carryforwards (NOLs) of approximately $2.5 billion related to U.S. federal, state and foreign jurisdictions. Utilization of NOLs, which begin to expire at various times starting in 2010, may be subject to certain limitations. Approximately $1.2 billion of our NOLs relate to tax deductible stock-based compensation in excess of amounts recognized for financial reporting purposes--to the extent any of this amount is realized, the resulting benefit will be credited to stockholders' equity, rather than results of operations. Net Loss -- Although we reported a $13 million improvement in our net loss, we believe that this improvement is not necessarily predictive of future trends for a variety of reasons. For example, we are unable to forecast the effect on our future reported results of certain items, including the stock-based compensation charges or credits associated with variable accounting treatment on certain stock awards that result from fluctuations in our stock price and the gain or loss associated with the remeasurement of our 6.875% PEACS that results from fluctuations in foreign exchange rates. These items represented significant charges during the first quarter of 2003 and may result in significant charges or credits in future periods. Financial Condition -- Our cash, cash equivalents and marketable securities, at estimated fair value, consist of the following at March 31, 2003 (in millions): Cash $204 Commercial paper and short-term obligations 292 -------- Cash and cash equivalents 496 -------- U.S. Treasury notes and bonds 271 Asset-backed and agency securities 245 Corporate notes and bonds 44 Certificates of deposit, commercial paper, short-term obligations and equity securities 27 -------- Marketable securities (1) 587 -------- $1,083 ========
-----------------
(1) We have pledged approximately $105 million as collateral for property leases and other contractual obligations, compared with $158 million at March 31, 2002.
-- Long-term debt primarily includes the following (in millions):
Principal Interest Principal at Maturity Rate Due Date -------------------------------------Senior Discount Notes $264 (1) 10.000% May 2008Convertible Subordinated Notes 1,250 (2) 4.750% February 2009PEACS 753 (3) 6.875% February 2010 ------ $2,267 ======
-----------------
(1) We announced that on May 28, 2003, we will redeem our Senior Discount Notes at a redemption price of $277 million, a 5% premium over the principal amount of $264 million. We will record a charge of approximately $15 million, classified in non-operating expenses in the second quarter 2003, consisting of the $13 million premium and $2 million of unamortized debt issuance costs. Accrued interest from May 1, 2003 to May 27, 2003 will also be payable at redemption.
(2) Convertible at the holders' option into our common stock at $78.03.
(3) 690 million Euros. Convertible at the holders' option into our common stock at 84.88 Euros. The U.S. Dollar long-term debt amount and conversion price fluctuates based on the Euro/U.S. Dollar exchange ratio.
Certain Definitions and Other -- We present segment information along two lines: North America and International. We measure operating results of our segments using an internal performance measure of direct segment operating expenses that excludes stock-based compensation, amortization of goodwill and other intangibles, and restructuring-related and other charges, each of which are not allocated to segment results. All other centrally-incurred operating costs are fully allocated to segment results. There are no internal revenue transactions between our reporting segments. -- The North America segment consists of amounts earned from retail sales of consumer products through www.amazon.com and www.amazon.ca (including from third-party sellers), from North America focused Syndicated Stores and mail-order catalogs and from non-retail activities such as North America focused Merchant.com, marketing and promotional agreements. -- The International segment consists of amounts earned from retail sales of consumer products through www.amazon.co.uk, www.amazon.de, www.amazon.fr and www.amazon.co.jp (including from third-party sellers), from internationally focused Syndicated Stores and from non-retail activities such as internationally focused marketing and promotional agreements. This segment includes export sales from www.amazon.co.uk, www.amazon.de, www.amazon.fr and www.amazon.co.jp (including export sales from these sites to customers in the U.S. and Canada), but excludes export sales from www.amazon.com and www.amazon.ca. Operating results for the International segment are affected by movements in foreign exchange rates. -- We have also provided supplemental revenue information within each segment for three categories: "Media", "Electronics and other general merchandise" and "Other." Media consists of amounts earned from retail sales from all sellers of books, music, DVD/video, magazine subscriptions, software and video games. Electronics and other general merchandise consists of amounts earned from retail sales from all sellers of items not included in Media, such as electronics, toys, home improvement, home and garden, and apparel. The Other category consists of non-retail activities, such as the Merchant.com program and miscellaneous marketing and promotional activities. -- All references to customers mean customer accounts, which are unique e-mail addresses, established either when a customer's initial order is shipped or when a customer orders from certain third-party sellers on our Web sites. Customer accounts include customers of Amazon Marketplace, Auctions and zShops and our Merchants@ and Syndicated Stores Programs, but exclude Merchant.com Program customers, Amazon.com Payments customers, our catalog customers and the customers of select companies with whom we have a technology alliance or marketing and promotional relationships. A customer is considered active upon placing an order. -- All references to units mean units sold (net of returns and cancellations) by us and third-party sellers at Amazon.com domains worldwide--such as www.amazon.com, www.amazon.ca, www.amazon.fr, www.amazon.co.uk, www.amazon.de and www.amazon.co.jp--and at Syndicated Stores domains, as well as Amazon.com-owned items sold at non-Amazon.com domains, such as books, music and DVD/video items ordered from Amazon.com's store at www.target.com. Units do not include Amazon.com gift certificates. CONTACT: Amazon.com Investor Relations: Tim Halladay, 206/266-2171 ir@amazon.com or Public Relations: Bill Curry, 206/266-7180 SOURCE: Amazon.Com