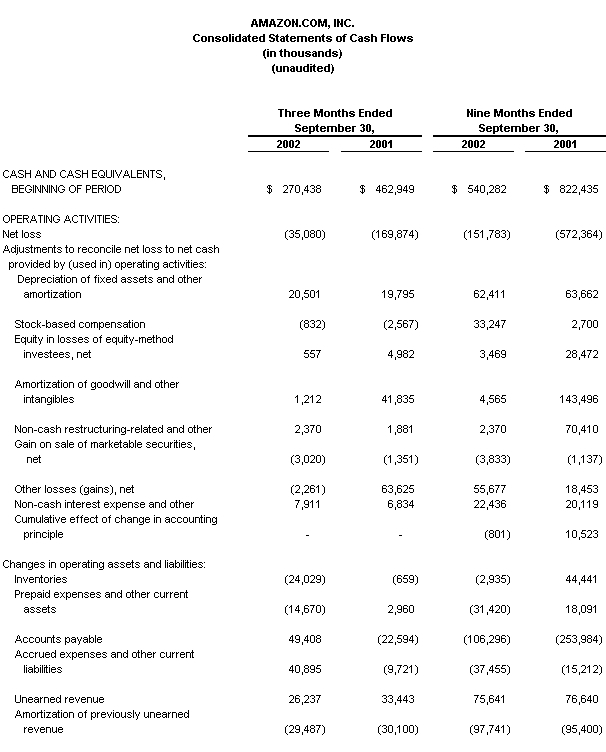
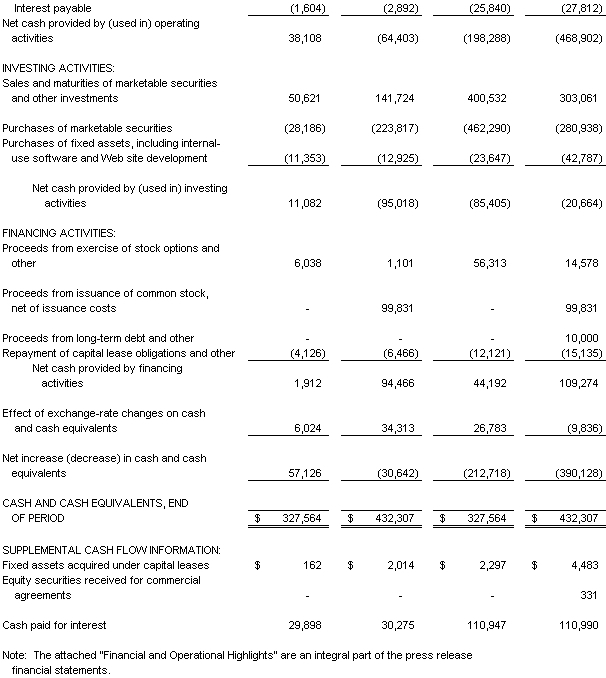
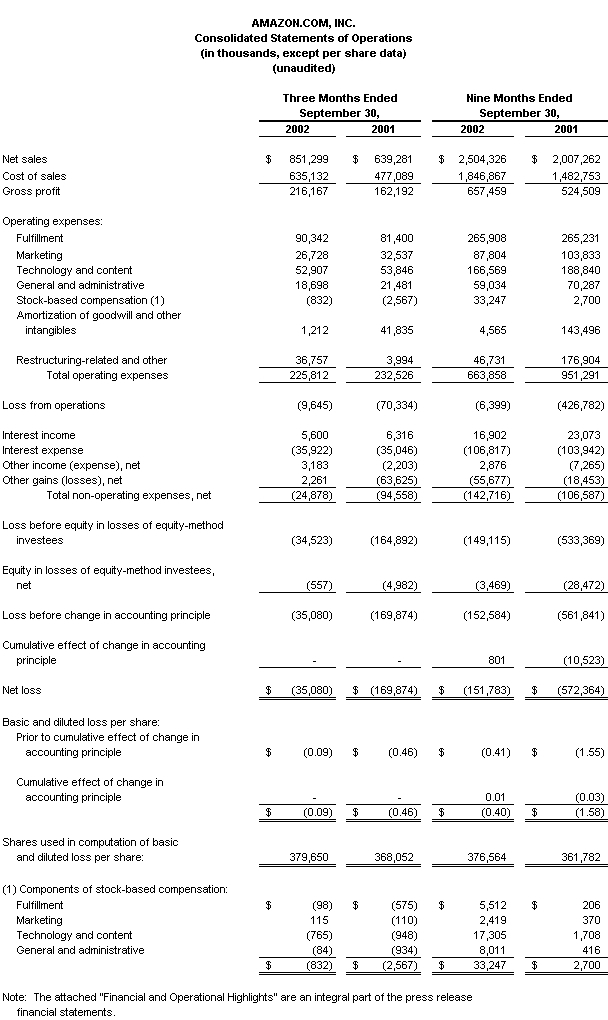
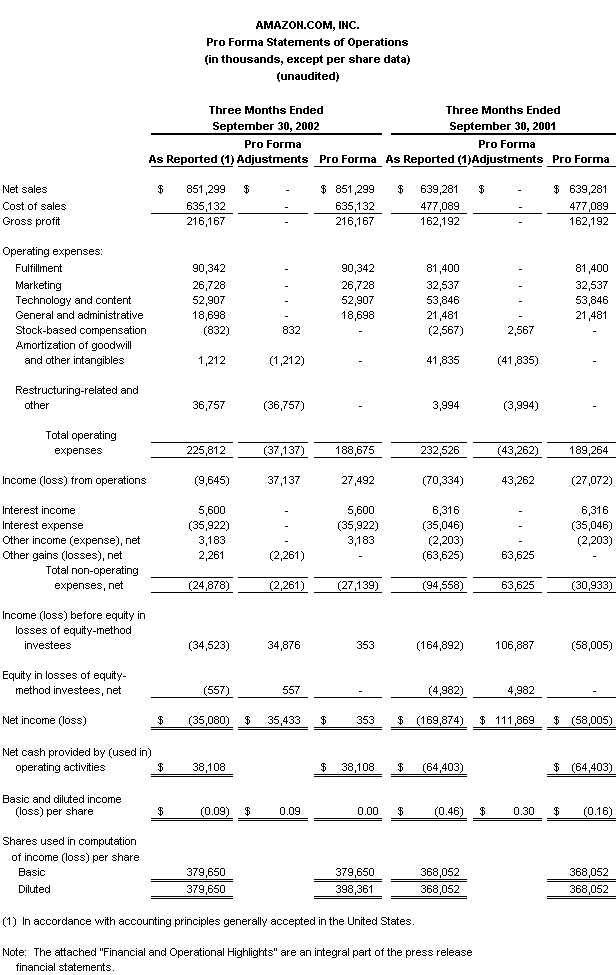
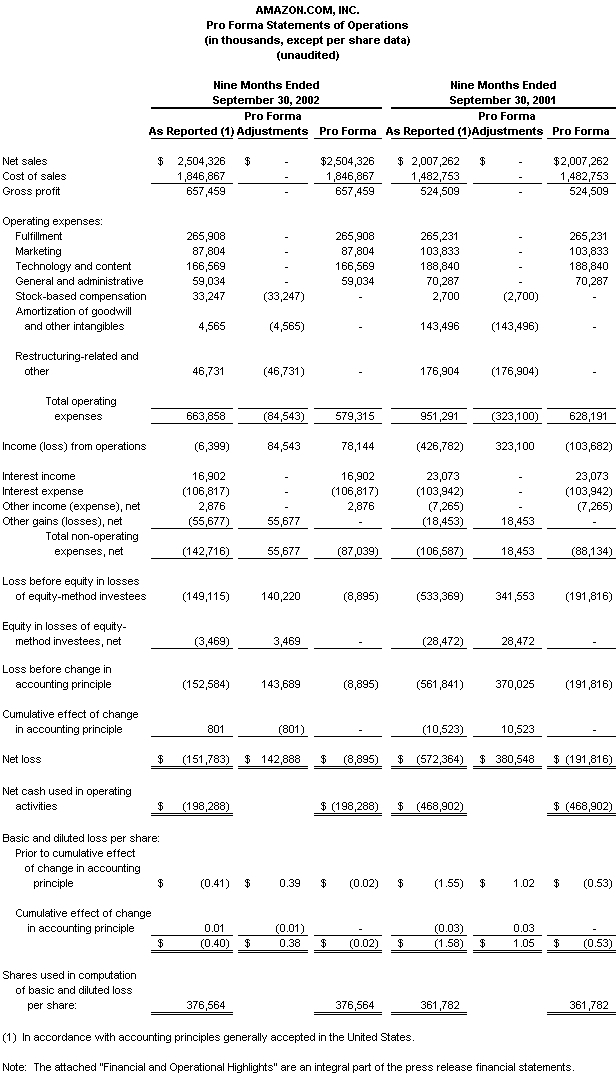
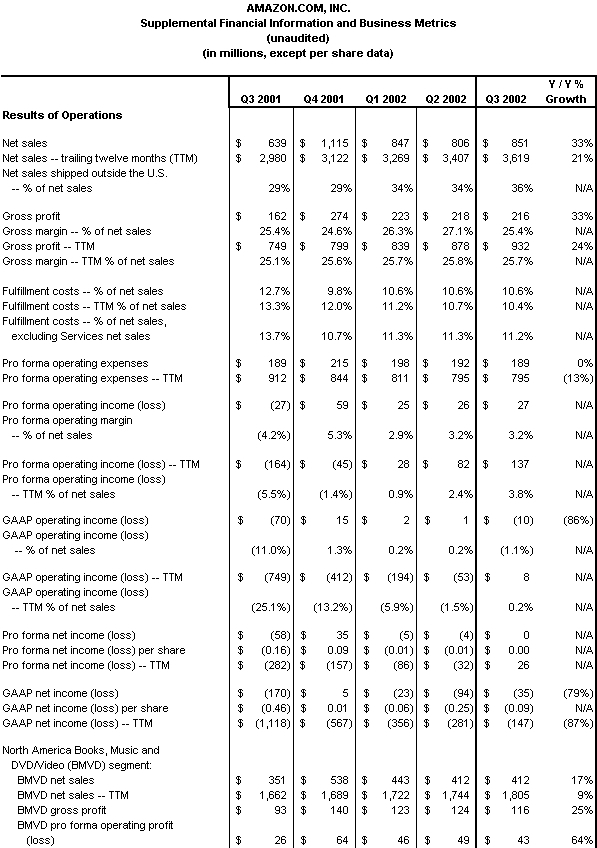
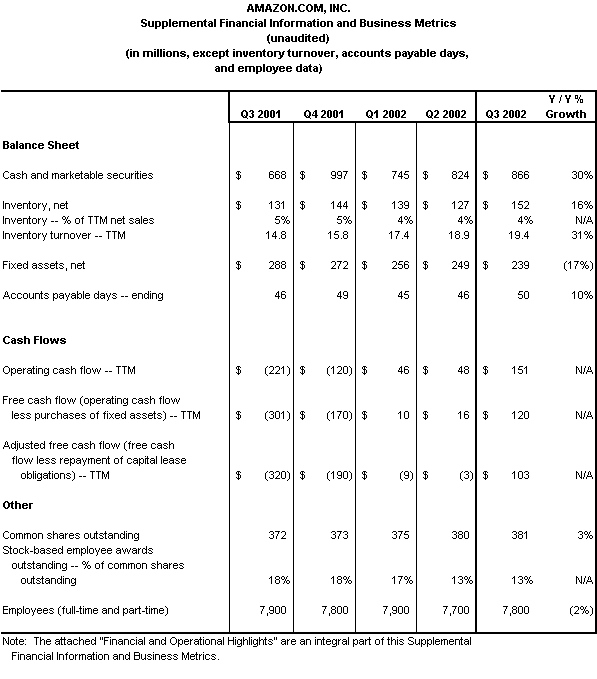
SEATTLE-(BUSINESS WIRE)-October 24, 2002-Amazon.com, Inc. (NASD: AMZN), today announced financial results for its third quarter ended September 30, 2002. Free cash flow was $120 million for the trailing four quarters, compared with negative $301 million for the four quarters ended September 2001. Free cash flow includes cash outflows for interest and capital expenditures and excludes proceeds from the exercise of stock-based employee awards. Common shares outstanding plus shares underlying stock-based employee awards totaled 430 million at September 30, 2002, a decrease of 2% compared with a year ago. Net sales were $851 million, compared with $639 million in the third quarter 2001, an increase of 33%, exceeding the Company's guidance of between $780 million and $830 million. Operating loss was $10 million, including restructuring-related and other charges of $37 million, compared with a loss of $70 million a year ago. Pro forma operating profit was $27 million, or 3% of net sales, exceeding the Company's guidance of between $8 million and $17 million. This compares with a pro forma operating loss of $27 million in the third quarter 2001, an improvement of over $54 million. Net loss was $35 million, or $0.09 per share, compared with a third quarter 2001 net loss of $170 million, or $0.46 per share. Pro forma net profit, which includes interest expense, was $0.4 million, or $0.00 per share, compared with a pro forma net loss of $58 million, or $0.16 per share, in the third quarter 2001. (Details on the differences between GAAP results and pro forma results are included below, with a tabular reconciliation of those differences included in the attached financial statements.) "We've lowered prices five times over the last 15 months, and simply put, it's working," said Jeff Bezos, founder and CEO of Amazon.com. "Based on the results so far, we've made the decision to leave Super Saver Shipping-free on orders over $25-in place at least through the holidays." Today, Amazon.com offers 30% off books over $15; significantly lowered prices on electronics, tools, and bestselling CDs and DVDs; and Free Super Saver Shipping on orders over $25. Highlights of Third Quarter Results (comparisons are with the equivalent period of 2001)
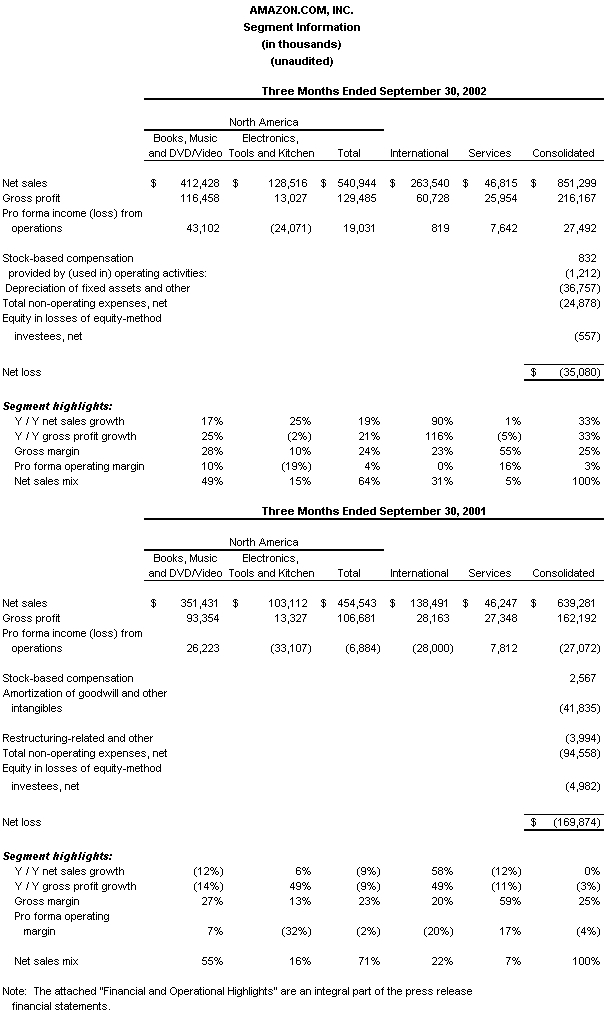
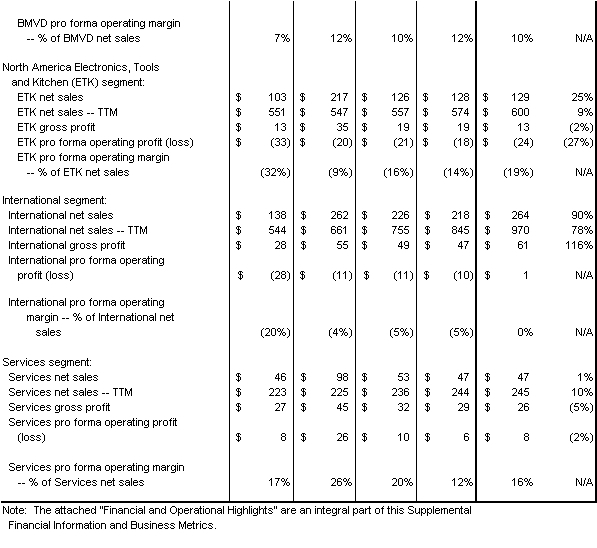
- International segment sales, representing the Company's U.K., German, French and Japanese sites, grew 90% to $264 million, and each site's sales grew by over 60%. Pro forma operating profit was $0.8 million, compared to a loss of $28 million.
- Third-party seller transactions (new, used and refurbished items sold on Amazon.com product detail pages by businesses and individuals) grew sequentially to 23% of North American units, compared with 16% of units a year ago.
- Books, Music and DVD/Video segment sales growth rate accelerated to 17%, or $412 million. Pro forma operating profit grew 64% to $43 million, or 10% of Books, Music and DVD/Video sales.
- Electronics, Tools and Kitchen segment sales growth accelerated to 25%, reaching $129 million, unit growth was 39%, and pro forma operating loss declined 27% to $24 million.
- Pro forma net profit for the trailing four quarters, a first for the Company, was $26 million. Pro forma operating profit was $137 million for the trailing four quarters, or a record 4% of net sales.
- Inventory turns improved 31% to 19 for the trailing four quarters, up from 15.
Financial Guidance and 2003 Expectations The following forward-looking statements reflect Amazon.com's expectations as of October 24, 2002. Results may be materially affected by many factors, such as changes in general economic conditions and consumer spending, the emerging nature and rate of growth of the Internet and online commerce, and the various factors detailed below. Fourth Quarter 2002 Guidance
- Fourth quarter net sales are expected to be between $1.325 billion and $1.425 billion, or grow between 19% and 28%.
- Fourth quarter pro forma operating profit is expected to be between $70 million and $95 million.
Full Year 2003 Expectations
- Net sales are expected to grow over 10%.
- Pro forma operating profit is expected to be over $200 million. This amount could be impacted, either positively or negatively, by the investment choices the Company makes for the long term.
A conference call will be Webcast live at www.amazon.com/ir today at 2 p.m. PT/5 p.m. ET and will be available through December 31, 2002. This call will contain forward-looking statements and other material information. These forward-looking statements are inherently difficult to predict. Actual results could differ materially for a variety of reasons, including, among others, the rate of growth of the economy in general and of the Internet and online commerce; customer spending patterns; the amount that Amazon.com invests in new business opportunities and the timing of those investments; the mix of products sold to customers; the mix of net sales derived from products as compared with services; competition; risks of inventory management; the degree to which the Company enters into, maintains and develops service relationships with third-party sellers and other strategic transactions; foreign-currency exchange risks; seasonality; international growth and expansion; risks of fulfillment throughput and productivity; and fluctuations in the value of securities and non-cash payments Amazon.com receives in connection with such transactions. Other risks and uncertainties include, among others, risk of future losses, significant amount of indebtedness, potential fluctuations in operating results, management of potential growth, system interruptions, consumer trends, fulfillment center optimization, inventory, limited operating history, government regulation and taxation, customer or third-party sellers fraud, Amazon.com Payments, and new business areas, business combinations and strategic alliances. More information about factors that potentially could affect Amazon.com's financial results is included in Amazon.com's filings with the Securities and Exchange Commission, including its Annual Report on Form 10-K for the year ended December 31, 2001, and all subsequent filings. Pro Forma Results Pro forma results, which generally exclude non-operational, non-cash expenses and income as well as one-time charges, are provided as a complement to results provided in accordance with accounting principles generally accepted in the United States (known as "GAAP"). Management uses such pro forma measures internally to evaluate the Company's performance and manage its operations. A reconciliation of GAAP to pro forma is included in the attached financial statements. Pro forma operating results exclude the following line items on the Company's statements of operations:
- Stock-based compensation
- Amortization of goodwill and other intangibles, and
- Restructuring-related and other.
Pro forma net results exclude, in addition to the line items described above, the following line items on the Company's statements of operations:
- Other gains (losses), net,
- Equity in losses of equity-method investees, net, and
- Cumulative effect of change in accounting principle.
About Amazon.com Amazon.com, a Fortune 500 company based in Seattle, opened its virtual doors on the World Wide Web in July 1995 and today offers Earth's Biggest Selection. Amazon.com seeks to be the world's most customer-centric company, where customers can find and discover anything they might want to buy online at a great price. Amazon.com and sellers list millions of unique new and used items in categories such as electronics, computers, kitchen and housewares, books, music, DVDs, videos, cameras and photo items, office products, toys, baby items and baby registry, software, computer and video games, cell phones and service, tools and hardware, travel services, magazine subscriptions and outdoor living items. Through Amazon Marketplace, zShops and Auctions, any business or individual can sell virtually anything to Amazon.com's millions of customers. Amazon.com operates five international Web sites: www.amazon.ca, www.amazon.co.uk, www.amazon.de, www.amazon.fr and www.amazon.co.jp. Contact: Amazon.com Investor Relations
Tim Halladay, 206/266-2171, ir@amazon.com Amazon.com Public Relations
Bill Curry, 206/266-7180
-->
|
AMAZON.COM, INC.
Financial and Operational Highlights
Third Quarter Ended September 30, 2002
(unaudited) Results of Operations (all comparisons are with the equivalent period of 2001) Net Sales
- The benefit to International segment net sales from foreign-currency exchange rate fluctuations was approximately $22 million ($1 million benefit to pro forma operating profit).
- Shipping revenue, excluding commissions earned from Amazon Marketplace, was approximately $73 million, down from $74 million.
- The negative impact on prior year net sales as a result of September 11, 2001, was estimated at between $25 million and $35 million.
Gross Profit
- Shipping loss increased to approximately $10 million, from a loss of $2 million. We continue to measure our shipping results relative to their impact on our overall financial results, with the viewpoint that shipping promotions are an effective marketing tool. We expect to continue offering our customers free shipping offers, which reduce shipping revenue as a percentage of sales and negatively affect gross margins on our retail sales.
Fulfillment
- Fulfillment costs represent those costs incurred in operating and staffing our fulfillment and customer service centers, including costs attributable to receiving, inspecting and warehousing inventories; picking, packaging and preparing customers' orders for shipment; credit card fees and bad debt costs; and responding to inquiries from customers. Fulfillment costs also include amounts paid to third-party cosourcers, who assist us in fulfillment and customer service operations. Certain Services segment fulfillment-related costs incurred on behalf of third-party sellers are classified as cost of sales rather than fulfillment.
Stock-Based Compensation
- During the first quarter 2001, we offered a limited non-compulsory exchange of employee stock options, which results in variable accounting treatment for approximately 8 million stock options at September 30, 2002, including approximately 7 million options granted under the exchange offer with an exercise price of $13.375. Variable accounting treatment will result in unpredictable charges or credits dependent on the fluctuations in quoted prices for our common stock, which we are unable to forecast.
- Cumulative compensation expense recorded at September 30, 2002, associated with variable accounting was approximately $29 million--based on exercises to date and a quarter-end closing common stock price of $15.93-of which $12 million is associated with options exercised and no longer subject to future variability.
- We have quantified the hypothetical effect on stock-based compensation associated with various quoted prices of our common stock using a sensitivity analysis for our outstanding stock options subject to variable accounting. We have provided this information to give additional insight into the future volatility we may experience in our results of operations to the extent that the quoted price for our common stock is above $13.375. This sensitivity analysis is not a prediction of future performance of the quoted prices of our common stock. Using the following hypothetical market prices of our common stock above $13.375 (including the actual expense associated with options exercised), our hypothetical cumulative compensation expense at September 30, 2002, and the difference between hypothetical cumulative compensation expense and actual cumulative compensation expense recorded at September 30, 2002, resulting from variable accounting treatment would have been as follows (in thousands):
Hypothetical Increase
Over $13.375 | Hypothetical Market
Price per Share | Hypothetical Cumulative Compensation Expense | Hypothetical vs. Cumulative
Compensation Expense
September 30, 2002 | | | | | | 5% | $14.04 | $17,051 | $(12,424) | 10% | $14.71 | $21,618 | $ (7,857) | 15% | $15.38 | $26,185 | $ (3,290) | 25% | $16.72 | $35,319 | $ 5,844 | 50% | $20.06 | $58,155 | $ 28,680 |
- Commencing in the fourth quarter of 2002, stock-based compensation will also include amounts associated with our planned restricted stock unit program. Under this program, we will award restricted stock units as our primary vehicle for employee equity compensation. Restricted stock units are measured at fair value on the date of grant based on the number of shares granted and the quoted price of our common stock. Such value is recognized as an expense ratably over the corresponding service period. To the extent that restricted stock units are forfeited prior to vesting, the corresponding previously recognized expense is reversed as an offset to "Stock-based compensation."
Amortization of Goodwill and Other Intangibles
- As a result of our adoption of Statement of Financial Accounting Standards No. 141 and No. 142, during the first quarter 2002 we reclassified $25 million of other intangibles (comprising only assembled workforce intangibles) to goodwill and discontinued the amortization of our goodwill assets.
Restructuring-Related and Other - In January 2001, we initiated an operational restructuring plan to reduce our operating costs, streamline our organizational structure, consolidate certain of our fulfillment and customer service operations and migrate a large portion of our technology infrastructure to a new operating platform. The restructuring plan is complete, although estimates may be adjusted prospectively if necessary.
- In the third quarter of 2002, corresponding with our January 2001 operational restructuring, we recorded an additional restructuring-related expense of $37 million associated with ongoing lease obligations relating to vacated office and fulfillment center space and other costs, including revised sublease income estimates to reflect current information and higher-than-expected tenant improvement costs necessary to sublease vacated space. We revised our restructuring-related expense estimate due to a number of factors, primarily related to weakness in the real estate markets in Seattle and Atlanta.
- Cash payments related to restructuring accruals were $8 million in the third quarter 2002, compared with $15 million. The restructuring charges are anticipated to result in the following net cash outflows (included within accrued expenses and other current liabilities and long-term debt and other on our balance sheet):
(in thousands) | Leases (a) | Other | Total | | | | | | Three Months Ending December 31, | | | | | 2002............................................................. | $ 6,235 | $ -- | $6,235 | | Year Ending December 31, | | | | | 2003............................................................. | 16,170 | 1,580 | 17,750 | | 2004............................................................. | 14,581 | 1,000 | 15,581 | | 2005............................................................. | 7,903 | 3,113 | 11,016 | | 2006............................................................. | 5,326 | -- | 5,326 | | Thereafter..................................................... | 17,872 | -- | 17,872 | | Total estimated cash outflows.............................. | $68,087 | $5,693 | $73,780 |
(a) Net of anticipated sublease income of approximately $53 million on gross lease obligations of $121 million.
Other Income (Expense), Net - Other income, net was $3 million for the third quarter 2002, primarily consisting of net realized gains on sales of marketable securities.
Other Gains (Losses), Net
- Other gains, net were $2 million for the third quarter 2002, and primarily consist of a $2 million net gain on sales of equity investments and a nominal foreign-currency gain on the remeasurement of our 6.875% convertible subordinated notes from Euros to U.S. dollars (we are unable to predict the gains or losses that will result from fluctuations in foreign exchange rates in future periods).
Income Taxes
- At December 31, 2001, we had net operating loss carryforwards (NOLs) of approximately $2.3 billion related to U.S. federal, state and foreign jurisdictions. Utilization of NOLs, which begin to expire at various times starting in 2010, may be subject to certain limitations. Approximately $1 billion of our NOLs relate to deductible stock-based compensation in excess of amounts recognized for financial reporting purposes--to the extent any of this amount is realized, the resulting benefit will be credited to stockholders' equity, rather than results of operations.
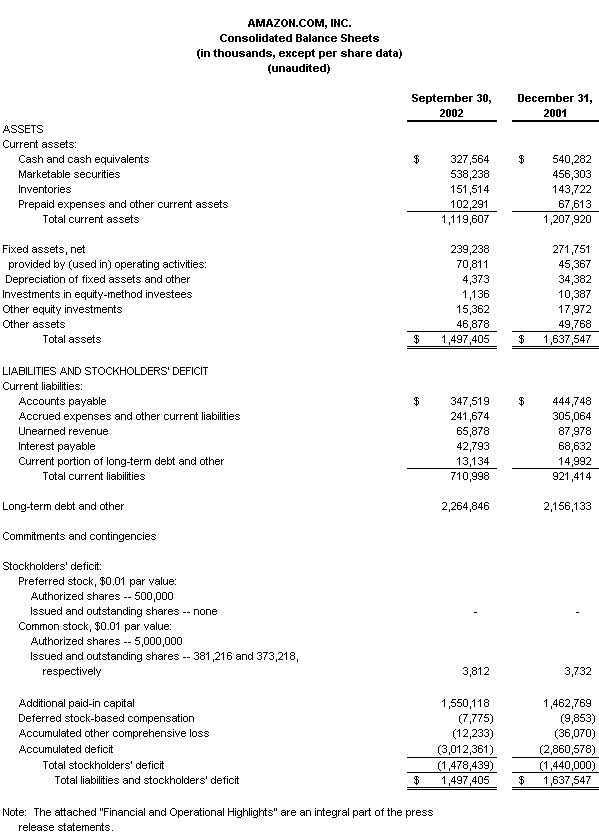
Financial Condition
- Our marketable securities, at estimated fair value, consist of the following, as of September 30, 2002 (in thousands):
| Asset-backed and agency securities | $327,561 | | Treasury notes and bonds | 132,557 | | Commercial paper and short-term obligations | 37,281 | | Certificates of deposit | 20,727 | | Corporate notes and bonds | 16,963 | | Equity securities | 3,149 | | | $538,238 |
- We have pledged approximately $135 million of our marketable securities as collateral for certain contractual obligations, compared with $167 million as of December 31, 2001. Amounts pledged for standby letters of credit that guarantee certain contractual obligations, primarily property leases, were $58 million; $37 million is pledged for a swap agreement that hedges the foreign-exchange-rate risk on a portion of our 6.875% convertible subordinated notes; and $40 million is pledged for certain of our real estate lease agreements. The amount of marketable securities we are required to pledge pursuant to the swap agreement fluctuates with the fair market value of the swap obligation.
- Prepaid expenses and other current assets primarily include accounts receivable, other receivables and prepaid advertising.
- Long-term debt includes the following:
| Principal
at Maturity
(in millions) | Interest
Rate | Principal
Due Date | | | | | | | Senior Discount Notes | $ 264 | 10.000% | May 2008 | | Convertible Subordinated Notes | 1,250 | 4.750% | February 2009 | | Convertible PEACS | 681(a) | 6.875% | February 2010 | | Total long-term debt | $2,195 | | |
(a) 690 million Euros.
Certain Definitions and Other
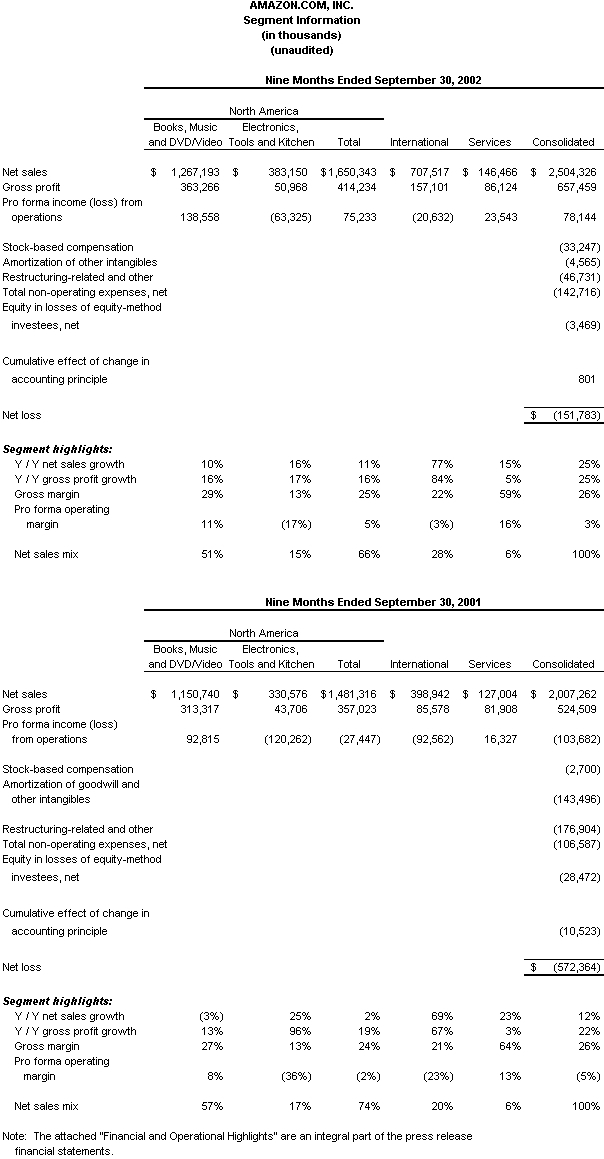
- Our segment reporting includes four segments: North America Books, Music and DVD/Video ("BMVD"); North America Electronics, Tools and Kitchen ("ETK"); International; and Services.
- Allocation methodologies for centrally incurred operating costs have been consistently applied and there are no internal transactions between segments.
- The BMVD segment includes revenues, direct costs and cost allocations primarily associated with retail sales from www.amazon.com and www.amazon.ca for books, music, DVDs, video products and magazine subscription commissions. This segment also includes revenues from stores offering these products through our Syndicated Stores Program, such as www.borders.com; commissions and other amounts earned from sales of these products through Amazon Marketplace; and from offerings of these products by third-party sellers (such as magazine subscriptions) under our Merchant@amazon.com Program.
- The ETK segment includes revenues, direct costs and cost allocations primarily associated with www.amazon.com retail sales of electronics, home improvement and home and garden products, as well as our catalog sales of toys and tools. This segment also includes commissions and other amounts earned from sales of these products through Amazon Marketplace and from offerings of these products by third-party sellers under our Merchant@amazon.com Program, including J&R Electronics.
- The International segment includes all revenues, direct costs and cost allocations associated with the retail sales of our U.K., German, French and Japanese Web sites--www.amazon.co.uk, www.amazon.de, www.amazon.fr and www.amazon.co.jp. This segment also includes commissions and other amounts earned from sales of products through Amazon Marketplace and revenues from stores offering these products through our Syndicated Stores Program.
- The Services segment includes revenues, direct costs and cost allocations associated with our business-to-business commercial agreements, including the Merchant Program, such as www.target.com, and, to the extent full product categories are not also offered by our online retail stores, the Merchant@amazon.com Program, such as Toysrus.com. This segment also includes our technology alliance with America Online and miscellaneous marketing, promotional and other agreements.
- All references to customers mean customer accounts, which are unique e-mail addresses, established either when a customer's initial order is shipped or when a customer orders from certain third-party sellers on our Web sites. Customer accounts include customers of Amazon Marketplace, Auctions, zShops and our Merchant@amazon.com and Syndicated Stores Programs, but exclude Merchant Program customers, Amazon.com Payments customers, our catalog customers and the customers of select companies with whom we have strategic marketing and promotional relationships. A customer is considered active upon placing an order.
|