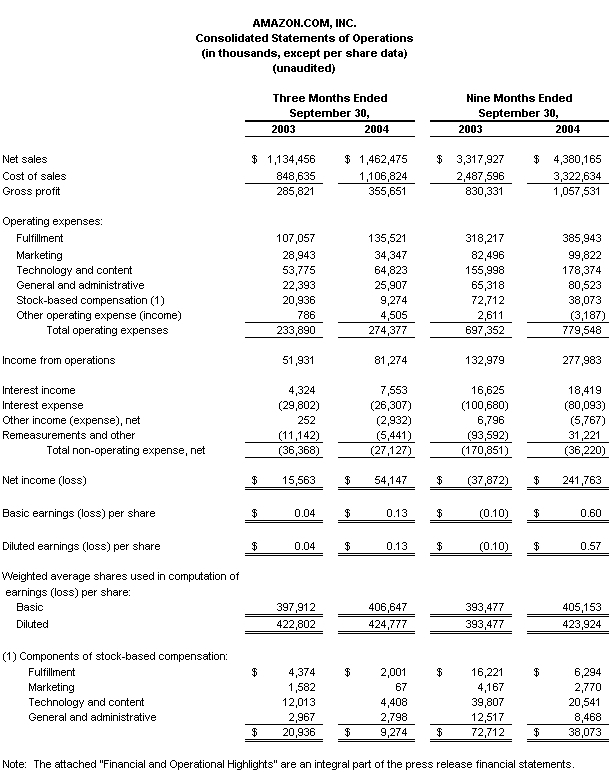
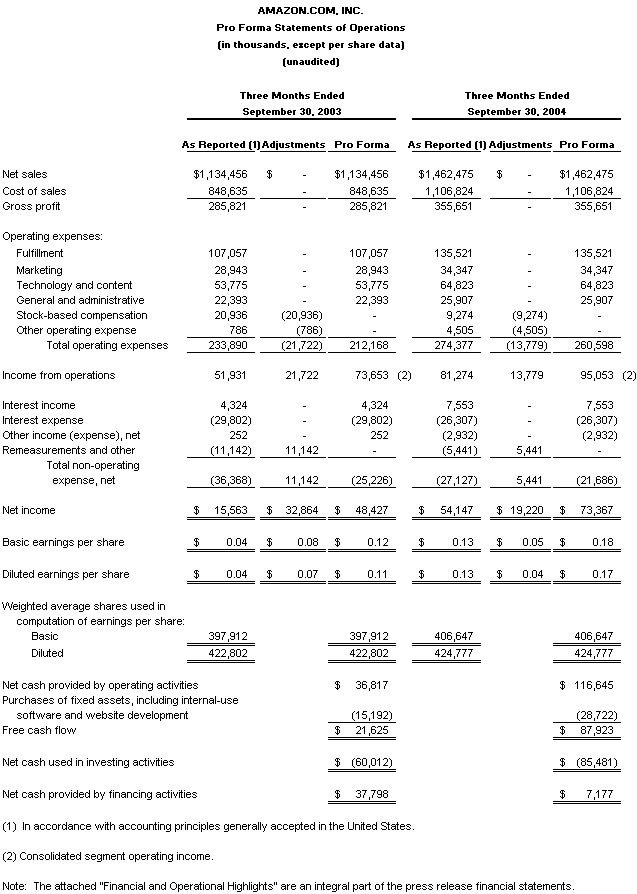
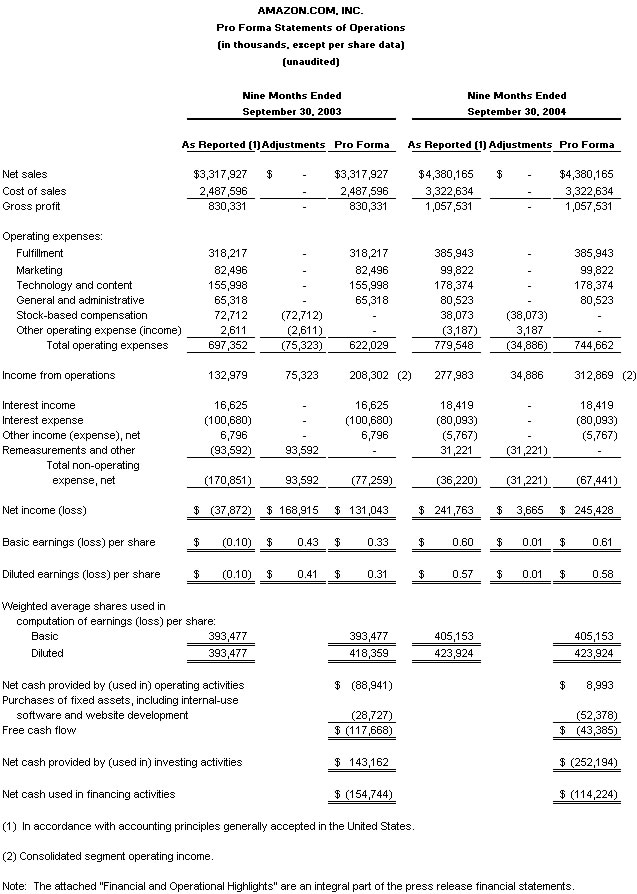
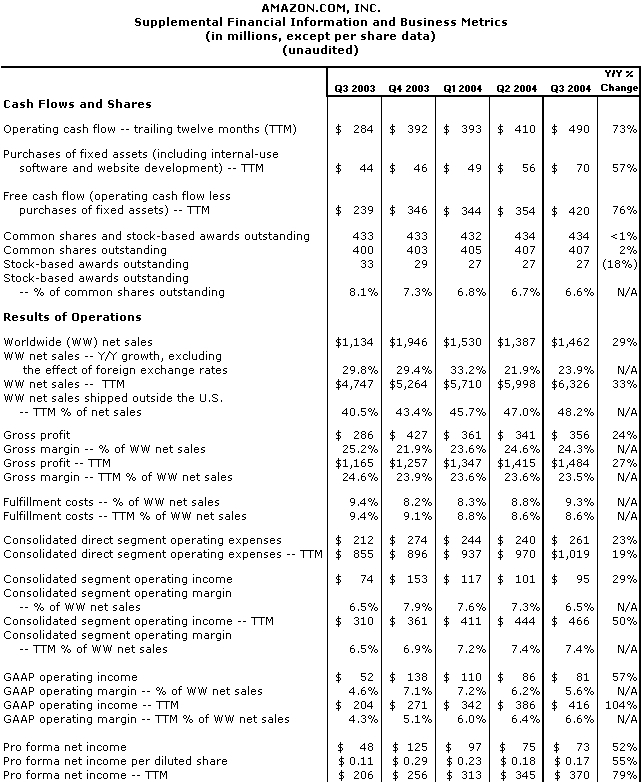
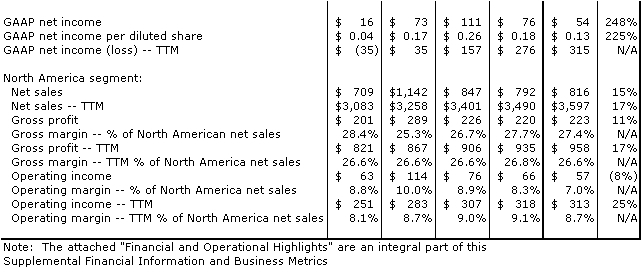
AMAZON.COM ANNOUNCES 76% FREE CASH FLOW GROWTH AND 29% SALES GROWTH - EXPECTS RECORD HOLIDAY SEASON WITH EXPANDED SELECTION, LOWER PRICES, AND FREE SHIPPING SEATTLE--(BUSINESS WIRE)--October 21, 2004--Amazon.com, Inc. (NASDAQ: AMZN) today announced financial results for its third quarter ended September 30, 2004. Operating cash flow was $490 million for the trailing twelve months, compared with $284 million for the trailing twelve months ended September 30, 2003. Free cash flow grew 76% to $420 million for the trailing twelve months, compared with $239 million for the 2003 period. Common shares outstanding plus shares underlying stock-based awards outstanding totaled 434 million at September 30, 2004, compared with 433 million a year ago. Net sales were $1.46 billion in the third quarter, compared with $1.13 billion in third quarter 2003, an increase of 29%. Net sales, excluding the $57 million benefit from changes in foreign exchange rates, grew 24% compared with 2003. Operating income was $81 million in the third quarter, compared with $52 million in third quarter 2003. Consolidated segment operating income grew 29% to $95 million in the third quarter, compared with $74 million in the third quarter 2003. Excluding the $4 million benefit from changes in foreign exchange rates, consolidated segment operating income grew 23% compared with third quarter 2003. Net income was $54 million in the third quarter, or $0.13 per diluted share, compared with net income of $16 million, or $0.04 per diluted share, in third quarter 2003. Pro forma net income in the third quarter grew 52% to $73 million, or $0.17 per diluted share, compared with $48 million, or $0.11 per diluted share, in third quarter 2003. "Our decision to put dollars into lower prices and free shipping instead of TV advertising continues to be embraced by customers," said Jeff Bezos, founder and CEO of Amazon.com. "Customer adoption of free shipping hit another record high this quarter." Amazon.com continues to lower shipping and product prices for its worldwide customers. Customers shopping at www.amazon.co.uk now qualify for free shipping on orders of £19 or more, down from the prior threshold of £25. See "Financial Measures" for additional information. Highlights
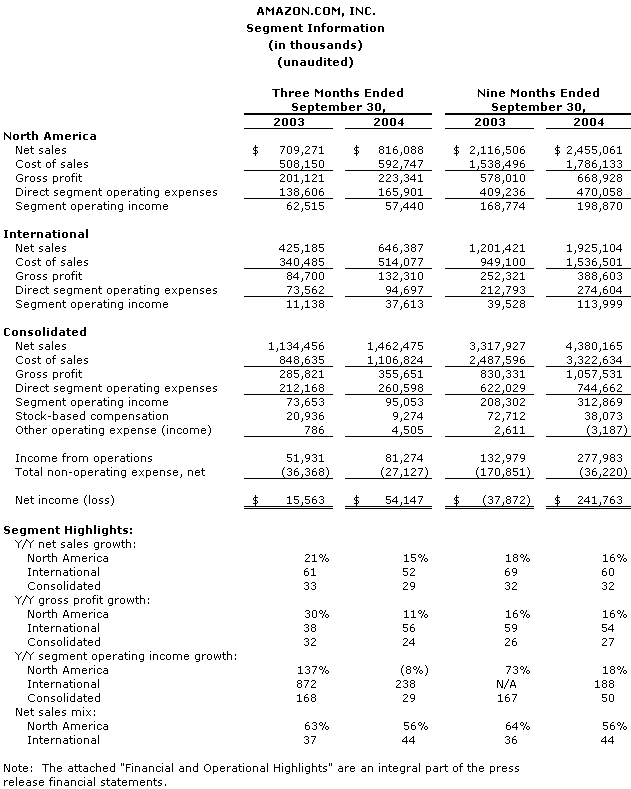
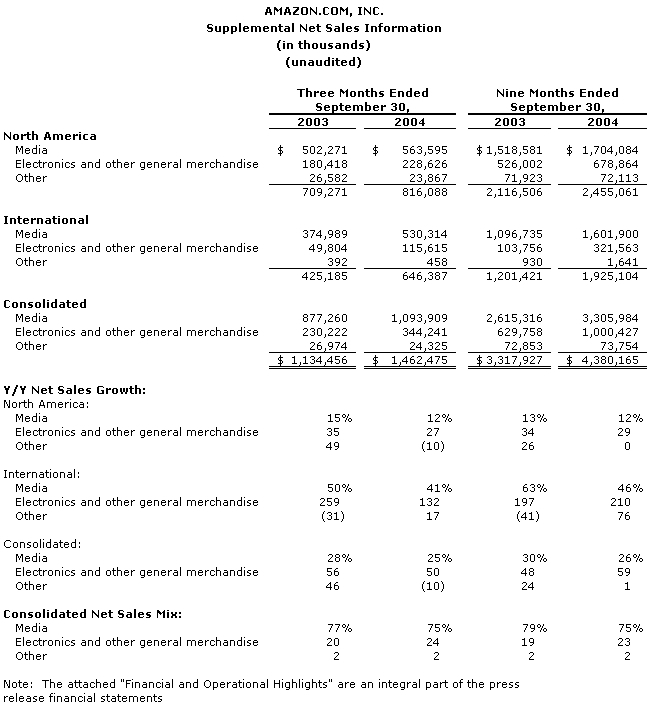
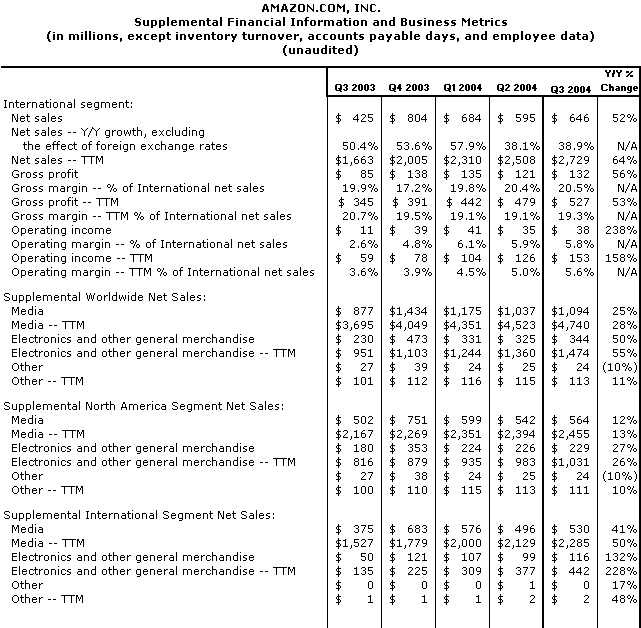
- North America segment sales, representing the Company's U.S. and Canadian sites, were $816 million, up 15% compared with third quarter 2003. Segment operating income declined $5 million to $57 million, compared with third quarter 2003. Increased adoption of free shipping contributed to an increase of $7 million in net shipping loss compared with the third quarter of 2003.
- International segment sales, representing the Company's U.K., German, French, Japanese, and Chinese sites, were $646 million, up 52% compared with third quarter 2003, and accounted for 44% of worldwide net sales. Excluding the benefit from exchange rates, net sales growth was 39%. Segment operating income grew $26 million to $38 million, compared with third quarter 2003.
- Electronics & Other General Merchandise sales grew 55% to $1.47 billion for the trailing twelve months, representing 23% of worldwide net sales. For the first time, North America Electronics & Other General Merchandise sales were over $1 billion on a trailing-twelve-month basis.
- A9.com, a subsidiary of Amazon.com, launched a search engine at www.a9.com, to make Internet search more effective. The "search engine with a memory" helps users manage and organize their search results, and discover additional information sources such as the Internet Movie Database and Amazon.com's Search Inside the Book results.
- Star Wars Trilogy was the top-selling DVD worldwide, and the U.K. site received a record 85,000 pre-orders.
- The Company introduced Toy stores at both its German and Japanese websites. Customers now have their choice of over 20,000 toys, games, and hobby products, and enjoy discounts up to 30%.
- Amazon Web Services released Amazon E-Commerce Service 4.0 (ECS 4.0), offering software developers and website owners unprecedented access to Amazon's technology platform and product data. Additionally, the Alexa Web Information Service (AWIS) gives first-ever access to the vast database of website information and usage data compiled by Alexa Internet (www.alexa.com). Access to both ECS 4.0 and AWIS is available at www.amazon.com/webservices, where over 65,000 individuals have registered and downloaded the free Amazon Web Services Software Developers Kit.
- Amazon.com's second U.K. fulfillment center in Scotland is fully operational and prepared to help meet holiday demand from European customers.
- The Company acquired Joyo.com Limited, a British Virgin Islands Company, which operates the Joyo.com website in cooperation with Chinese subsidiaries and affiliates. The Joyo.com website is the largest online retailer of books, music, and videos in China, and is Amazon.com's seventh global website.
Financial Guidance The following forward-looking statements reflect Amazon.com's expectations as of October 21, 2004. Results may be materially affected by many factors, such as fluctuations in foreign exchange rates, changes in global economic conditions and consumer spending, world events, the rate of growth of the Internet and online commerce, and the various factors detailed below.
Fourth Quarter 2004 Guidance - Net sales are expected to be between $2.295 billion and $2.545 billion, or grow between 18% and 31%, compared with fourth quarter 2003.
- Consolidated segment operating income is expected to be between $162 million and $222 million, or grow between 6% and 45%, compared with fourth quarter 2003.
- Operating income is expected to be between $137 million and $197 million, assuming, among other things, that the Company does not record any further revisions to its restructuring-related estimates and that the closing price of Amazon.com common stock on December 31, 2004, is identical to the closing price of $40.86 on September 30, 2004.
Full Year 2004 Guidance
- Net sales are expected to be between $6.675 billion and $6.925 billion, or grow between 27% and 32%, compared with 2003.
- Consolidated segment operating income is expected to be between $475 million and $535 million, or grow between 31% and 48%, compared with 2003.
- Operating income is expected to be between $415 million and $475 million, assuming, among other things, that the Company does not record any further revisions to its restructuring-related estimates and that the closing price of Amazon.com common stock on December 31, 2004, is identical to the closing price of $40.86 on September 30, 2004.
Full Year 2005 Expectations - Net sales are expected to be between $7.40 billion and $8.15 billion.
- Consolidated segment operating income is expected to be between $500 million and $625 million.
- Operating income is expected to be between $400 million and $525 million, excluding any impact from SFAS No. 123R, and assuming, among other things, that the Company does not record any further revisions to its restructuring-related estimates and that the closing price of Amazon.com common stock on December 31, 2005, is identical to the closing price of $40.86 on September 30, 2004.
A conference call will be webcast live today at 2 p.m. PT/5 p.m. ET, and will be available at least through December 31, 2004, at www.amazon.com/ir. This call will contain forward-looking statements and other material information regarding the Company's financial and operating results. These forward-looking statements are inherently difficult to predict. Actual results could differ materially for a variety of reasons, including, in addition to the factors discussed above, the amount that Amazon.com invests in new business opportunities and the timing of those investments; the mix of products sold to customers; the mix of net sales derived from products as compared with services; competition; management of growth; potential fluctuations in operating results; fulfillment center optimization; risks of inventory management; seasonality; the degree to which the Company enters into, maintains and develops commercial agreements, acquisitions and strategic transactions; international growth and expansion; and risks of fulfillment throughput and productivity. Other risks and uncertainties include, among others, risk of future losses, significant amount of indebtedness, system interruptions, consumer trends, limited operating history, government regulation and taxation, fraud, and new business areas. More information about factors that potentially could affect Amazon.com's financial results is included in Amazon.com's filings with the Securities and Exchange Commission, including its Annual Report on Form 10-K for the year ended December 31, 2003, and all subsequent filings. Financial Measures The following measures are defined by the Securities and Exchange Commission as non-GAAP financial measures. Free Cash Flow Operating cash flow is net cash provided by (used in) operating activities, including cash outflows for interest and excluding proceeds from the exercise of stock-based employee awards. Free cash flow is operating cash flow less cash outflows for purchases of fixed assets, including internal-use software and website development. A tabular reconciliation of differences from the comparable GAAP measure—operating cash flow—is included in the attached "Supplemental Financial Information and Business Metrics." Consolidated Segment Operating Income Consolidated segment operating income is the sum of segment operating income of our individual segments and excludes the following line items on the Company's statements of operations:
- Stock-based compensation and
- Other operating expense (income).
A tabular reconciliation of differences from the comparable GAAP measure—operating income—is included in the attached "Pro Forma Statements of Operations." Pro Forma Net Income Pro forma net income excludes the following line items on the Company's statements of operations:
- Stock-based compensation,
- Other operating expense (income), and
- Remeasurements and other.
A tabular reconciliation of differences from the comparable GAAP measure—net income (loss)—is included in the attached "Pro Forma Statements of Operations." For additional information regarding these non-GAAP financial measures, see Exhibit 99.2 to our Form 8-K filed contemporaneously with the issuance of this release. About Amazon.com Amazon.com (NASDAQ: AMZN), a Fortune 500 company based in Seattle, opened its virtual doors on the World Wide Web in July 1995 and today offers Earth's Biggest Selection. Amazon.com seeks to be Earth's most customer-centric company, where customers can find and discover anything they might want to buy online, and endeavors to offer customers the lowest possible prices. Amazon.com and third-party sellers offer millions of unique new, refurbished, and used items in categories such as health and personal care, jewelry and watches, gourmet food, sports and outdoors, apparel and accessories, books, music, DVDs, electronics and office, toys and baby, and home and garden. Amazon.com and its affiliates operate seven websites: www.amazon.com, www.amazon.co.uk, www.amazon.de, www.amazon.co.jp, www.amazon.fr, www.amazon.ca, and www.joyo.com. As used herein, "Amazon.com," "we," "our" and similar terms include Amazon.com, Inc. and its subsidiaries, unless the context indicates otherwise.
|
AMAZON.COM, INC.
Financial and Operational Highlights
(unaudited) Quarterly Results of Operations (comparisons are with the equivalent period of the prior year, unless otherwise stated)
Net Sales
- Shipping revenue, which excludes amounts earned from third-party sellers, was $87 million, up 13% from $77 million.
Cost of Sales- Cost of sales consists of the purchase price of consumer products sold by us, inbound and outbound shipping charges to us, packaging supplies, and costs incurred in operating and staffing our fulfillment and customer service centers on behalf of other businesses, such as Toysrus.com and Target.com.
- Outbound shipping-related costs totaled $128 million, up from $104 million. Net shipping loss was $41 million, up from a net loss of $27 million, resulting primarily from our free-shipping offers. We view free-shipping offers as an effective worldwide marketing tool and intend to continue offering them indefinitely.
Direct Segment Operating Expense- Third quarter direct segment operating expenses as a percentage of net sales were as follows:
| | 2004 | 2003 | | Fullfillment | 9.3% | 9.4% | | Technology and content | 4.4% | 4.7% | | Marketing | 2.3% | 2.6% | | General and administrative | 1.8% | 2.0% |
- Depreciation was $19 million in third quarter 2004 and $72 million over the trailing twelve months.
Fulfillment - Fulfillment costs include those costs incurred in operating and staffing our fulfillment and customer service centers, credit card fees, and bad debt costs, including costs associated with our guarantee for certain third-party seller transactions. Fulfillment costs also include amounts paid to third parties, who assist us in fulfillment and customer service operations.
- Credit card fees associated with third-party seller transactions are based on the gross purchase price of underlying transactions, and therefore represent a larger percentage of our recorded revenue than credit card fees on our retail sales. Bad debt costs, including costs associated with our guarantee program, are also higher as a percentage of recorded revenue versus our retail sales. Accordingly, fulfillment costs as a percentage of net sales are higher for third-party seller transactions than for our retail sales.
- Our new fulfillment center in Scotland began fulfilling customer orders in the third quarter and is now fully operational. The center is approximately 300,000 square feet and currently employs over 200 permanent associates.
- Fulfillment costs decreased as a percentage of sales from the prior year, but increased in absolute dollars due to variable costs corresponding with sales volume, our mix of product sales, credit card fees, and bad debt costs, including costs associated with our guarantee for certain third-party seller transactions. We expect absolute amounts spent in fulfillment to increase over time.
Technology and Content
- Our spending in technology and content has increased as we are adding computer scientists and software engineers to enhance the customer experience on our websites and those websites powered by us, and improve our process efficiency. Additionally, we continue to invest in several areas of technology, including seller platform, A9.com, web services, and additional development centers. We intend to continue investing in these and other initiatives and expect absolute dollars spent in technology and content to increase over time as we continue to add computer scientists and software engineers to our staff.
- A significant majority of these costs are incurred in the U.S. and most of them are allocated to our North America segment.
- We expense all costs related to the development of internal-use software other than those incurred during the application development stage. Costs incurred during the application development stage are capitalized and amortized over the estimated useful life of the software, generally two years. For the three months ended September 30, 2004 and 2003, we capitalized $12 million and $9 million of internal-use software costs, which was offset by amortization of previously capitalized amounts of $8 million and $6 million.
Marketing - Marketing efforts include targeted online marketing channels, such as our Associates and Syndicated Stores programs, portal advertising, e-mail campaigns, sponsored search, and other initiatives. Since our marketing expenses are largely variable, we expect absolute amounts spent in marketing to increase over time. To the extent there is increased or decreased competition for these traffic sources, or to the extent our mix of these channels shifts, we would expect to see a corresponding change in our marketing expense. While costs associated with free shipping are not included in marketing expense, we view our free-shipping offers as an effective worldwide marketing tool and intend to continue offering them indefinitely.
General and Administrative
- General and Administrative costs increased primarily due to increases in professional fees. We expect absolute dollars spent in general and administrative to increase over time.
Stock-Based Compensation - Since October 2002, we have awarded restricted stock units as our primary form of stock-based compensation. Restricted stock units, under fixed accounting, are generally measured at fair value on the date of grant based on the number of shares granted and the quoted price of our common stock. Such value is recognized as an expense on an accelerated basis over the corresponding service period. To the extent that restricted stock units are forfeited prior to vesting, the corresponding previously recognized expense is reversed as an offset to stock-based compensation.
- Stock-based awards generally fully vest over service periods of between three and six years.
- Stock-based compensation was $9 million for the quarter, consisting of $6 million in contra-expense for stock awards under variable accounting, and $15 million for stock awards under fixed accounting plus matching stock contributions under our 401(k) program. Payroll tax expense resulting from exercises of stock-based awards is not classified in "Stock-based compensation," but is allocated to the corresponding operating expense categories on the statement of operations.
- We granted 0.7 million stock awards, primarily restricted stock units, during the quarter at a per-share weighted average fair value of $40.12. Year-to-date we have granted 2.7 million stock awards, primarily restricted stock units, at a per-share average fair value of $44.59.
- At September 30, 2004, there were 27 million stock awards outstanding, consisting of 20 million stock options with a $12.90 weighted average exercise price, 6 million restricted stock units, and 0.5 million shares of restricted stock (included in common stock outstanding).
- At September 30, 2004, 1.4 million outstanding stock awards, primarily options, were subject to variable accounting. Stock option grants after December 31, 2002, are subject to variable accounting treatment. Variable accounting treatment results in expense or contra-expense recognition using the cumulative expense method, calculated based on the quoted price of our common stock and vesting schedules of underlying awards. For example, since the closing price of our common stock on September 30, 2004, $40.86, was lower than the closing price on June 30, 2004, $54.40, we recorded a contra-expense associated with variable accounting treatment for the third quarter of 2004.
Other Operating Expense (Income)
- Included in "Other operating expense (income)" are restructuring-related expenses or credits and amortization of other intangibles. Amortization of other intangibles was $0.3 million and $1 million for the three months ended September 30, 2004 and 2003.
- Our first quarter 2001 operational restructuring plan is complete; however, we may periodically adjust our restructuring-related estimates, such as lease obligations, in the future if necessary.
- Cash payments resulting from our 2001 operational restructuring were $2 million, compared with $3 million in 2003.
- We streamlined our organizational structure in France to reduce our operating costs. The severance terms associated with these efforts were finalized in the third quarter, and corresponding costs of $4 million were recorded. We expect payment to occur in the fourth quarter of 2004.
- We estimate, based on currently available information, the remaining net cash outflows associated with restructuring-related leases and other commitments will be $5 million in 2004, and $16 million thereafter. Amounts due within twelve months are included within "Accrued expenses and other current liabilities" and the remaining amounts within "Long-term debt and other" on our balance sheet. These amounts are net of anticipated sublease income of $25 million (we have signed sublease agreements for $13 million).
Other Income (Expense), Net
- Other expense in third quarter 2004 was primarily foreign, state, and other income taxes.
Remeasurements and Other
- Remeasurements includes foreign-currency losses on remeasurement of 6.875% PEACS from Euros to U.S. Dollars of $17 million, compared with a loss of $12 million.
- Other includes a $7 million gain from the remeasurement of foreign-currency intercompany balances, which are to be repaid amongst subsidiaries, and a $4 million gain on sales of Euro-denominated investments.
Income Taxes - At September 30, 2004, we had net operating loss carryforwards (NOLs) of approximately $2.8 billion, primarily related to U.S. federal taxes. Utilization of NOLs, which begin to expire at various times starting in 2010, may be subject to certain limitations. Approximately $1.0 billion of our NOLs are attributable to continuing operations, and the related tax benefits, if realized, will be credited to results of operations for both financial reporting and tax reporting purposes. The remainder, approximately $1.8 billion, relates to tax deductible stock-based compensation in excess of amounts recognized for financial reporting purposes, and the related tax benefits, if realized, will be credited to stockholders' equity rather than to results of operations for financial reporting purposes.
Net Income (Loss)
- We believe that our reported net income for the third quarter 2004 should not be viewed, on its own, as a material positive event and is not necessarily predictive of future results for a variety of reasons. For example, we are unable to forecast the effect on our future reported results of certain items, including the effect that fluctuations in foreign currency rates will have on the remeasurement of our 6.875% PEACS and intercompany balances. The remeasurement of our 6.875% PEACS represented a significant charge during the quarter and may result in significant charges or gains in future periods.
- Additionally, we are unable to forecast the effect of stock-based compensation, which is based in part on the quoted price of our common stock in accordance with variable accounting treatment. In the third quarter of 2004 variable accounting treatment resulted in a credit to our operating results of $6 million due to a decline in price of our common stock. Comparisons to prior year quarter and year-to-date periods show improvement in operating income of $16 million and $46 million resulting from the effects of changing stock prices on variable accounting treatment. Variable accounting has resulted in significant expense and contra-expense in past periods and will continue to be unpredictable going forward.
Foreign Exchange- As our financial reporting currency is the U.S. Dollar, our total sales, profit, and operating and free cash flow have benefited significantly the past nine quarters from weakness in the U.S. Dollar in comparison to the currencies of our international websites. We believe it is important to evaluate our growth rates after the effect of currency changes.
The effect of changes in exchange rates in the third quarter is as follows (in millions):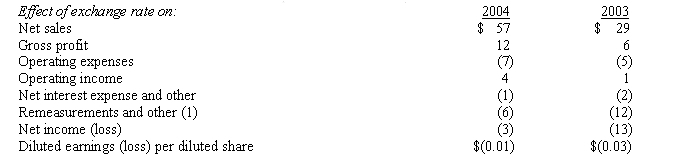 (1) Includes foreign-currency gains (losses) on remeasurement of 6.875% PEACS and intercompany balances, and realized currency-related gains associated with sales of Euro-denominated investments held by a U.S. functional-currency subsidiary. (1) Includes foreign-currency gains (losses) on remeasurement of 6.875% PEACS and intercompany balances, and realized currency-related gains associated with sales of Euro-denominated investments held by a U.S. functional-currency subsidiary. These amounts represent the impact on reported results that is due to year-over-year changes in exchange rates. Absent year-over-year changes in exchange rates, reported amounts would have been lower (higher) by these amounts.
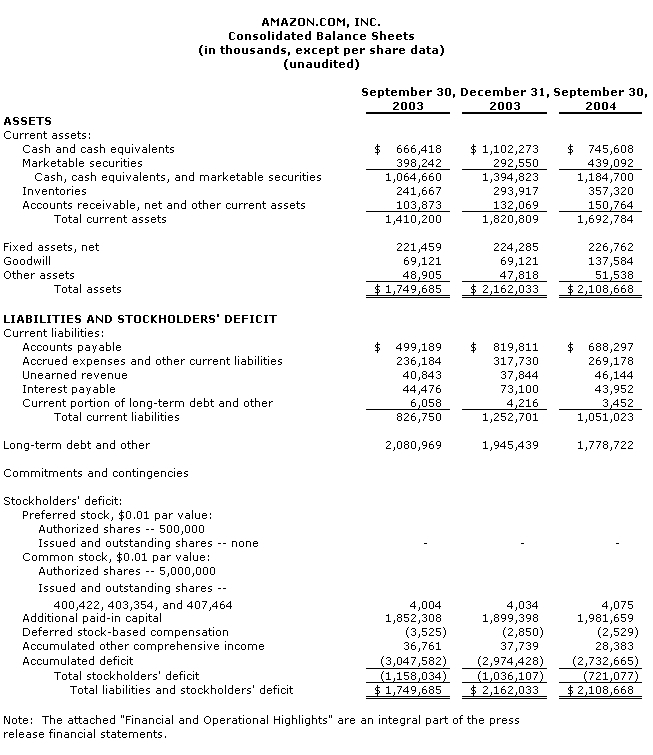
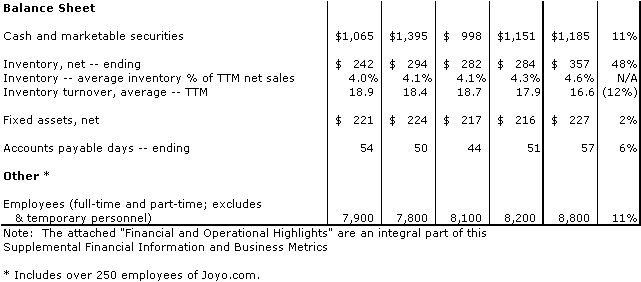
Cash Flows and Balance Sheet Operating cash flows and free cash flows can be volatile and are sensitive to many factors, including changes in working capital. Working capital at any specific point in time is subject to many variables, including world events, seasonality, the timing of expense payments, discounts offered by vendors, vendor payment terms, and fluctuations in foreign exchange rates. Our cash, cash equivalents, and marketable securities of $1.18 billion, at fair value, primarily consist of cash, commercial paper and short-term securities, U.S. Treasury notes and bonds, asset-backed, and agency securities and certificates of deposit. Included is amounts held in foreign currencies of $693 million, primarily in Euros, British Pounds, and Yen. - We have pledged $76 million of our marketable securities as collateral for property leases and other contractual obligations, compared with $87 million as of December 31, 2003.
- On September 7, 2004 we acquired all outstanding shares of Joyo.com Limited, a British Virgin Islands Company, which operates the Joyo.com website in cooperation with Chinese subsidiaries and affiliates. The Joyo.com website is the largest online retailer of books, music, and videos in China, and is Amazon.com's seventh global website. Results of operations for Joyo.com have been included in our consolidated results from the date of acquisition forward. Results were not significant in the third quarter, and are not expected to be significant in the fourth quarter. The purchase price was $74 million, composed of $72 million in cash, the assumption of employee stock options, and transaction-related costs. We recorded $68 million in goodwill related to the acquisition.
- "Other assets" includes, among other things, deferred issuance costs on long-term debt, other equity investments, and intangibles.
- "Unearned revenue" is recorded when payments are received from third parties in advance of our providing the associated service.
- "Accrued expenses and other current liabilities" includes, among other things, liabilities for gift certificates, marketing activities, and workforce costs, including accrued payroll, vacation, and other benefits.
- "Long-term debt and other" primarily includes the following (in millions):
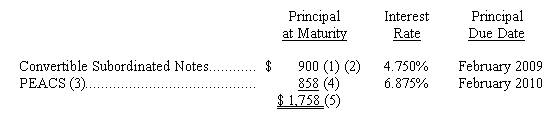
(1) Convertible at the holders' option into our common stock at $78.0275 per share. We have the right to redeem the Convertible Subordinated Notes, in whole or in part, at a redemption price of 102.375% of the principal, which decreases every February by 47.5 basis points until maturity, plus any accrued and unpaid interest.
(2) During the previous twelve-month period we redeemed an aggregate principal amount of $350 million: $150 million in February 2004 and $200 million in November 2003.
(3) PrEmium Adjustable Convertible Securities.
(4) €690 million principal amount, convertible at the holders' option into our common stock at €84.883 per share ($105.56 per share based on the exchange rate as of September 30, 2004). We have the right to redeem the PEACS, in whole or in part, by paying the principal amount, plus any accrued and unpaid interest. We do not hedge any portion of the PEACS. The U.S. Dollar equivalent principal, interest, and conversion price fluctuates based on the Euro/U.S. Dollar exchange ratio. Due to fluctuations in this exchange ratio, our principal debt obligation since issuance in February 2000 has increased by $178 million as of September 30, 2004.
(5) The "if converted" number of shares associated with our convertible debt instruments (approximately 20 million total shares) are excluded from diluted shares as their effect is anti-dilutive.
Certain Definitions and Other
- We present segment information along two lines: North America and International. We measure operating results of our segments using an internal performance measure of direct segment operating expenses that excludes stock-based compensation and other operating expenses (income), each of which is not allocated to segment results. Other centrally incurred operating costs are fully allocated to segment results. Our operating results, particularly for the International segment, are affected by movements in foreign exchange rates.
- The North America segment consists of amounts earned from retail sales of consumer products (including from third-party sellers) through www.amazon.com and www.amazon.ca; from North America focused Syndicated Stores, such as www.cdnow.com; from our mail-order tool catalog; and from non-retail activities such as North America focused Merchant.com, marketing, and promotional agreements. This segment includes export sales from www.amazon.com and www.amazon.ca.
- The International segment consists of amounts earned from retail sales of consumer products (including from third-party sellers) through www.amazon.co.uk , www.amazon.de, www.amazon.co.jp, www.amazon.fr, and, since September 7, 2004, www.joyo.com; from internationally focused Syndicated Stores; and from non-retail activities such as internationally focused marketing and promotional agreements. This segment includes export sales from these internationally based sites (including export sales from these sites to customers in the U.S. and Canada), but excludes export sales from www.amazon.com and www.amazon.ca.
- We provide supplemental sales information within each segment for three categories: "Media," "Electronics and other general merchandise," and "Other." Media consists of amounts earned from retail sales from all sellers of books, music, DVD/video, magazine subscriptions, software, video games, and video game consoles. Electronics and other general merchandise consists of amounts earned from retail sales from all sellers of items not included in Media, such as electronics and office, toys and baby, tools, home and garden, apparel, sports and outdoors, gourmet food, jewelry, health and personal care, beauty, and musical instruments. The Other category consists of non-retail activities, such as the Merchant.com program and miscellaneous marketing and promotional activities.
- Operating cycle is number of days of sales in inventory plus number of days of sales in accounts receivable minus accounts payable days. Inventory turnover is the quotient of trailing-twelve-months cost of sales to average inventory. Accounts payable days is calculated as the quotient of accounts payable to cost of sales, multiplied by the number of days in the period.
- References to customers mean customer accounts, which are unique e-mail addresses, established either when a customer's initial order is shipped or when a customer orders from certain third-party sellers on our websites. Customer accounts include customers of Amazon Marketplace, Auctions and zShops, and our Merchants@ and Syndicated Stores programs, but exclude Joyo.com customers, Merchant.com program customers, Amazon.com Payments customers, our catalog customers, and the customers of select companies with whom we have a technology alliance or marketing and promotional relationship. A customer is considered active when they have placed an order during the preceding twelve-month period.
- References to sellers or merchants mean active seller accounts, which are established when a seller receives an order from a customer account. Seller accounts include sellers in Amazon's Marketplace, Auctions, zShops, and Merchants@ platforms, but exclude Merchant.com sellers. A seller is considered active when they have received an order during the preceding twelve-month period.
- References to units mean units sold (net of returns and cancellations) by us and third-party sellers at Amazon.com domains worldwide—such as www.amazon.com, www.amazon.co.uk, www.amazon.de, www.amazon.co.jp, www.amazon.fr, and www.amazon.ca—and at Syndicated Stores domains, as well as Amazon.com-owned items sold through catalogs and at non-Amazon.com domains, such as books, music, and DVD/video items ordered from Amazon.com's store at www.target.com. Units do not include Joyo.com units sold or Amazon.com gift certificates.
Contacts: Amazon.com Investor Relations Amazon.com Public Relations
Tim Stone, 206/266-2171, ir@amazon.com Patty Smith, 206/266-7180
www.amazon.com/ir
|