AMAZON.COM ANNOUNCES FREE SHIPPING AND LOW PRICES FUEL 42% UNIT GROWTH
SEATTLE—(BUSINESS WIRE)—July 22, 2003—Amazon.com, Inc. (NASDAQ: AMZN) today announced financial results for its second quarter ended June 30, 2003.
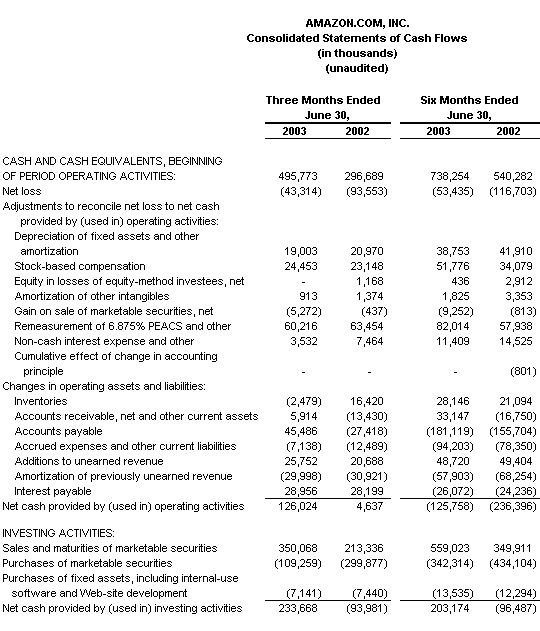
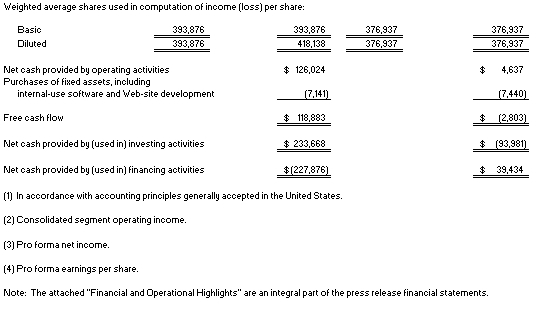
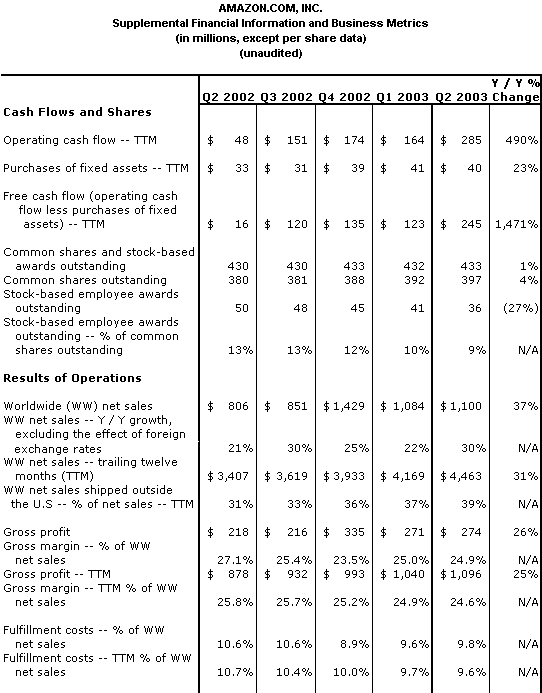
Operating cash flow was $285 million for the trailing twelve months, compared with $48 million for the trailing twelve months ended June 30, 2002. Free cash flow was $245 million for the trailing twelve months, compared with $16 million for the trailing twelve months ended June 30, 2002.
Common shares outstanding plus shares underlying stock-based employee awards totaled 433 million at June 30, 2003, an increase of 1% compared with a year ago.
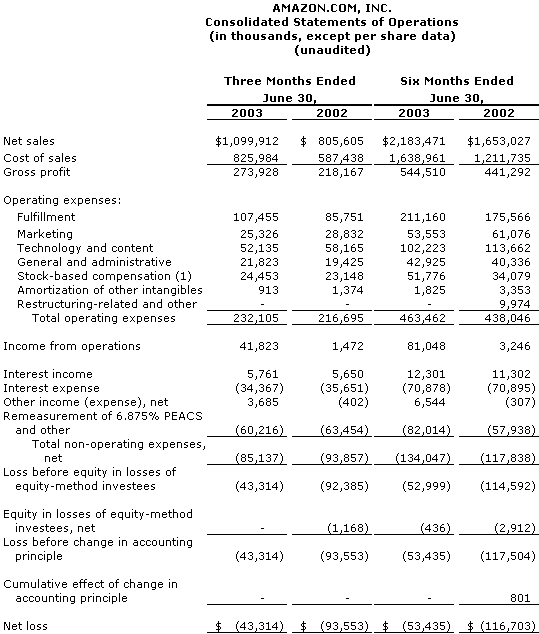
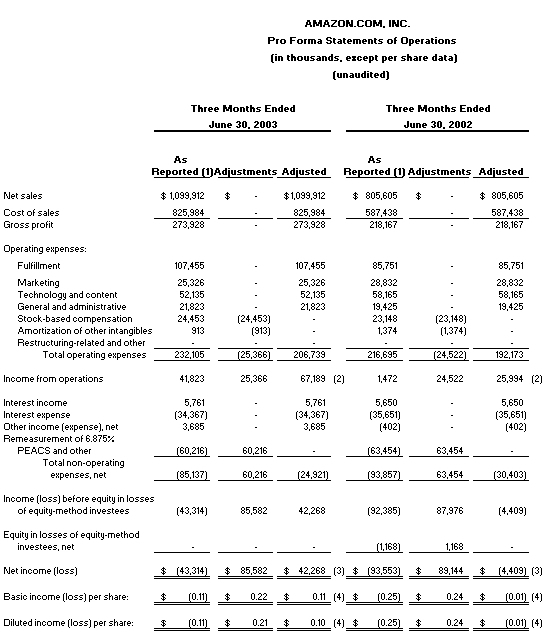
Net sales were $1.1 billion in the second quarter, compared with $806 million in the second quarter 2002, an increase of 37%. Net sales benefited by $55 million from changes in foreign exchange rates compared with the second quarter 2002.
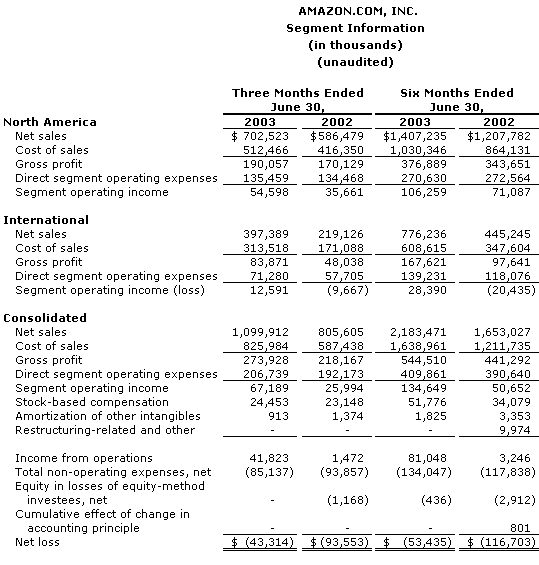
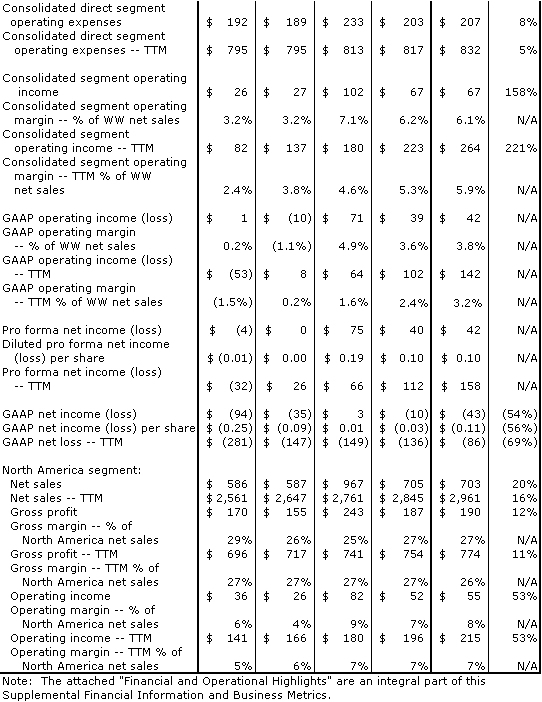
Operating income was $42 million, or 4% of net sales, compared with $1 million in the second quarter 2002. Consolidated segment operating income improved $41 million to $67 million, or 6% of net sales, compared with $26 million in the second quarter 2002.
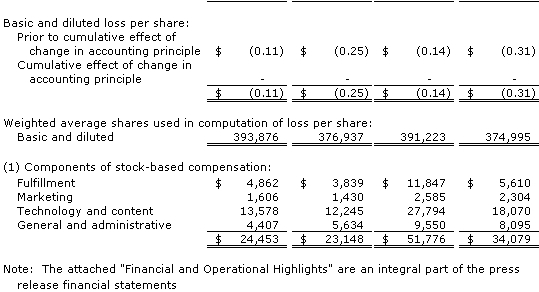
Net loss was $43 million, or $(0.11) per share, in the second quarter, compared with $94 million, or $(0.25) per share, in the second quarter 2002. Pro forma net income in the second quarter, which includes interest expense, grew over $46 million to $42 million, or $0.10 per share, compared with a pro forma net loss of $4 million, or $(0.01) per share, in the second quarter 2002.
"In January, we shifted money from TV and print advertising to customers through lower prices and free shipping," said Amazon.com founder and chief executive officer Jeff Bezos. "We're pleased with the results."
Today the Company also announced it is lowering its Free Super Saver Delivery threshold in the U.K. to £25 from £39. The Company currently offers Free Super Saver Shipping on orders over $25 at www.amazon.com and free shipping options at its German, French, Japanese and Canadian sites. Amazon.com also offers 30% off books over $15 and significant savings on electronics, tools, and bestselling CDs and DVDs.
"Amazon.com customers continue to respond in record numbers to our everyday low prices and free shipping," said Tom Szkutak, chief financial officer of Amazon.com. "Our strategy of offering low prices and free shipping, combined with the inherent advantages of online shopping, is allowing us to raise our guidance." See "Financial Measures" for additional information.
Highlights of Second Quarter 2003 Results (comparisons are with the equivalent period of 2002)
- Worldwide unit growth was 42% in the second quarter.
- In June 2003, the Company sold over 1.4 million units worldwide of Harry Potter and the Order of the Phoenix.
- Third-party seller transactions (new, used and refurbished items sold on the Company's product detail pages by businesses and individuals) grew to 20% of worldwide units in the second quarter, compared with 14% of units a year ago.
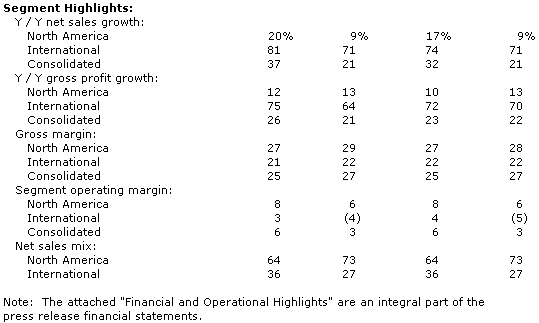
- North America segment sales, representing the Company's U.S. and Canadian sites, grew 20% to $703 million in the second quarter and segment operating income grew 53% to $55 million, or 8% of net sales.
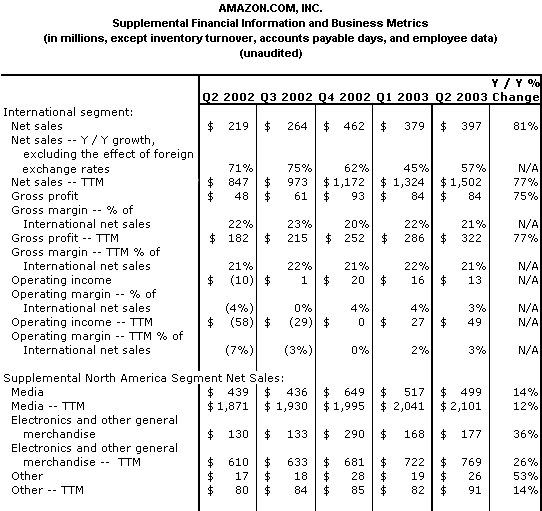
- International segment sales, representing the Company's U.K., German, French and Japanese sites, grew 81% to $397 million in the second quarter and benefited by $54 million from changes in foreign exchange rates compared with the second quarter 2002. International segment operating income was $13 million, a $22 million improvement.
- Inventory turns for the trailing four quarters improved to 20 for the second quarter, up from 19.
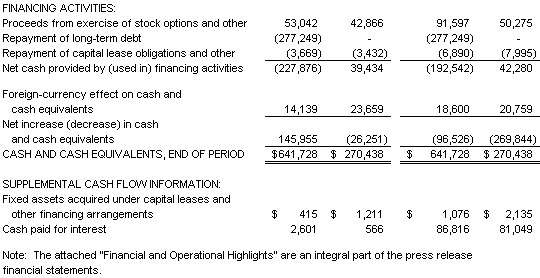
- On May 28, 2003, the Company redeemed all of its outstanding 10% Senior Discount Notes due May 2008, for $277 million, a redemption price of 105% of the $264 million principal amount.
Financial Guidance and 2003 Expectations
The following forward-looking statements reflect Amazon.com's expectations as of July 22, 2003. Results may be materially affected by many factors, such as fluctuations in foreign exchange rates, changes in global economic conditions and consumer spending, world events, the emerging nature and rate of growth of the Internet and online commerce, and the various factors detailed below.
Third Quarter 2003 Guidance
- Third quarter net sales are expected to be between $1.075 billion and $1.15 billion, or grow between 26% and 35%, compared with third quarter 2002.
- Consolidated segment operating income is expected to be between $55 million and $70 million.
- Operating income is expected to be between $40 million and $55 million, assuming among other things that the Company does not record any revisions to its restructuring-related estimates and that the closing price of Amazon.com common stock on September 30, 2003 is identical to the closing price of $36.32 on June 30, 2003.
Full Year 2003 Expectations
- Net sales are expected to be between $4.9 billion and $5.1 billion, or grow between 25% and 30%, compared with 2002.
- Consolidated segment operating income is expected to be between $300 million and $340 million.
- Operating income is expected to be between $215 million and $255 million, assuming among other things that the Company does not record any revisions to its restructuring-related estimates and that the closing price of Amazon.com common stock on September 30, 2003 and December 31, 2003 is identical to the closing price of $36.32 on June 30, 2003.
A conference call will be Webcast live today at 2 p.m. PT/5 p.m. ET and will be available at least through September 30, 2003, at www.amazon.com/ir. This call will contain forward-looking statements and other material information regarding the Company's financial and operating results.
These forward-looking statements are inherently difficult to predict. Actual results could differ materially for a variety of reasons, including, in addition to the factors discussed above, the amount that Amazon.com invests in new business opportunities and the timing of those investments; the mix of products sold to customers; the mix of net sales derived from products as compared with services; competition; risks of inventory management; the degree to which the Company enters into, maintains and develops commercial agreements and strategic transactions; seasonality; international growth and expansion; and risks of fulfillment throughput and productivity. Other risks and uncertainties include, among others, risk of future losses, significant amount of indebtedness, potential fluctuations in operating results, management of potential growth, system interruptions, consumer trends, fulfillment center optimization, limited operating history, government regulation and taxation, fraud and new business areas. More information about factors that potentially could affect Amazon.com's financial results is included in Amazon.com's filings with the Securities and Exchange Commission, including its Annual Report on Form 10-K for the year ended December 31, 2002, and all subsequent filings.
Financial Measures
The following measures are defined by the Securities and Exchange Commission as non-GAAP financial measures.
Free Cash Flow
Operating cash flow is net cash provided by (used in) operating activities, including cash outflows for interest and excluding proceeds from the exercise of stock-based employee awards. Free cash flow is operating cash flow less cash outflows for purchases of fixed assets including internal-use software and Website development. A tabular reconciliation of differences from the comparable GAAP measure—operating cash flow—is included in the attached "Supplemental Financial Information and Business Metrics."
Consolidated Segment Operating Income
Consolidated segment operating income is the sum of segment operating income of our individual segments and excludes the following line items on the Company's statements of operations:
- Stock-based compensation,
- Amortization of goodwill and other intangibles, and
- Restructuring-related and other.
A tabular reconciliation of differences from the comparable GAAP measure—operating income (loss)—is included in "Segment Information" in the attached financial statements.
Pro Forma Net Income (Loss)
Pro forma net income (loss) excludes the following line items on the Company's statements of operations:
- Stock-based compensation,
- Amortization of goodwill and other intangibles,
- Restructuring-related and other,
- Remeasurement of 6.875% PEACS and other,
- Equity in losses of equity-method investees, net, and
- Cumulative effect of change in accounting principle.
A tabular reconciliation of differences from the comparable GAAP measure—net income (loss)—is included in the attached "Pro Forma Statements of Operations."
For additional information regarding these non-GAAP financial measures, see exhibit 99.2 to our Form 8-K filed contemporaneously with the issuance of this release.
About Amazon.com
Amazon.com, a Fortune 500 company based in Seattle, opened on the World Wide Web in July 1995 and today offers Earth's Biggest Selection. Amazon.com seeks to be Earth's most customer-centric company, where customers can find and discover anything they might want to buy online, and endeavors to offer its customers the lowest possible prices. Amazon.com and other sellers list millions of unique new and used items in categories such as apparel and accessories, electronics, computers, kitchenware and housewares, books, music, DVDs, videos, cameras and photo items, toys, baby items and baby registry, software, computer and video games, cell phones and service, tools and hardware, magazine subscriptions and outdoor living items.
Amazon.com operates six Web sites: www.amazon.com, www.amazon.co.uk, www.amazon.de, www.amazon.fr, www.amazon.co.jp and www.amazon.ca.
|
AMAZON.COM, INC.
Financial and Operational Highlights
(unaudited) Second Quarter 2003 Results of Operations (comparisons are with the equivalent period of the prior year) Net Sales
- Shipping revenue, which excludes amounts earned from third-party sellers, was approximately $80 million, down from $81 million.
Gross Profit
- Gross profit benefited by approximately $12 million, and consolidated segment operating income by approximately $3 million, from changes in foreign exchange rates compared with second quarter 2002.
- Shipping loss was approximately $26 million, down from income of $2 million. We continue to measure our shipping results relative to their effect on our overall financial results, with the viewpoint that free shipping offers are an effective marketing tool. We intend to continue offering our customers free shipping alternatives, which will reduce shipping revenue as a percentage of sales and negatively affect gross margins.
Fulfillment
- Fulfillment costs represent those costs incurred in operating and staffing our fulfillment and customer service centers, credit card fees and bad debt costs. Fulfillment costs also include amounts paid to third-parties, who assist us in fulfillment and customer service operations. Certain of our fulfillment-related costs incurred on behalf of other businesses, such as Toysrus.com and Target, are classified as cost of sales rather than fulfillment.
- Credit card fees associated with third-party seller transactions represent a significant percentage relative to commission amounts earned, and as a result, negatively affect fulfillment as a percentage of net sales.
Stock-Based Compensation
- Stock based compensation consisted of $15 million for stock awards under variable accounting and $10 million for stock awards under fixed accounting. Stock based compensation includes matching contributions under our 401(k) program but excludes payroll tax expense resulting from exercises of stock-based awards.
- We granted 2 million stock awards during the quarter with vesting periods generally ranging from three to six years. At June 30, 2003, outstanding stock awards consisted of 32 million stock options ($12 average exercise price), 4 million restricted stock units and 1 million shares of restricted stock. Restricted stock is included in common stock outstanding; restricted stock units are not.
- Since the fourth quarter 2002, we have awarded restricted stock units as our primary form of stock-based compensation. Restricted stock units are generally measured at fair value on the date of grant based on the number of shares granted and the quoted price of our common stock. Such value is recognized as an expense over the corresponding service period. To the extent that restricted stock units are forfeited prior to vesting, the corresponding previously recognized expense is reversed as an offset to stock-based compensation.
- At June 30, 2003, 2 million stock awards are subject to variable accounting, of which less than 1 million options granted under the January 2001 exchange offer are scheduled to expire in the third quarter of 2003. Stock option grants after December 31, 2002 are subject to variable accounting treatment.
- Under variable stock award accounting, we will incur unpredictable charges or credits dependent on the fluctuations in market prices of our common stock, which we are unable to forecast. For example, if at the end of any quarter the quoted price of our common stock is lower than the quoted price at the end of the previous quarter, or to the extent previously-recorded amounts relate to unvested portions of awards that were cancelled, compensation expense associated with variable accounting will be recalculated using the cumulative expense method and may result in a net benefit to our results of operations.
- Using the following hypothetical market prices of our common stock above and below our June 30, 2003 closing price of $36.32, our hypothetical stock-based compensation expense for the three months ended June 30, 2003 would have been affected by variable accounting treatment as follows (in millions, except percentages and per share amounts):
Percentage Difference
Closing Price (1) | Hypothetical Market Price per Share (1) | Hypothetical
Stock-Based
Compensation Expense | Hypothetical vs.
Actual Stock-Based
Compensation Expense | (25)% | $27.24 | $15 | $(10) | (10)% | 32.69 | 20 | (4) | 0% | 36.32 | 24 (2) | — | 10% | 39.95 | 29 | 4 | 25% | 45.40 | 35 | 11 | | | | | |
______________
(1) Hypothetical—not a prediction of future performance of quoted prices of our common stock.
(2) Represents actual stock-based compensation expense for the second quarter 2003.
Restructuring-Related and Other
- As previously disclosed, in the first quarter 2001 we announced and began implementation of our operational restructuring plan. The restructuring is complete; however, we may adjust our restructuring-related estimates in the future, if necessary.
- Cash payments resulting from our operational restructuring were $4 million, compared with $13 million in the second quarter 2002.
- We estimate, based on currently available information, the remaining net cash outflows associated with restructuring-related leases and other commitments will be $6 million in the remainder of 2003, $12 million in 2004, and $19 million thereafter. Amounts due within 12 months are included within "Accrued expenses and other current liabilities" and the remaining amounts within "Long-term debt and other" on our balance sheet. These amounts are net of anticipated sublease income of approximately $47 million (we have signed sublease agreements on $10 million in future income) on gross lease obligations of $83 million.
Other Income, Net
- Other income, net primarily consisted of net gains on sales of marketable securities.
Remeasurement of 6.875% PEACS and Other
- Remeasurement of 6.875% PEACS and other primarily consisted of foreign-currency losses on remeasurement of 6.875% PEACS from Euros to U.S. Dollars of $38 million, compared with $71 million in the second quarter 2002.
- In connection with our May 28, 2003 redemption of our 10% Senior Discounts Notes, we recorded a charge of $15 million representing a 5% premium and $2 million of remaining deferred issuance costs. Additionally, we paid $2 million for interest accrued between May 1, 2003 and May 28, 2003 which was recorded to "Interest expense."
- During the second quarter of 2003, we terminated our cross-currency swap agreement that hedged a portion of principal and interest payments on our PEACS. No cash was paid or received to terminate the swap agreement, however we recorded a charge of $6 million to "Remeasurement of 6.875% PEACS and other," representing the remaining fair value of the swap asset. At June 30, 2003, the balance of the cumulative losses related to the swap agreement, included in "Accumulated other comprehensive income (loss)" on our consolidated balance sheets, was $14 million, which will be amortized to "Remeasurement of 6.875% PEACS and other" over the remaining life of the PEACS. If we redeem or otherwise restructure our PEACS prior to maturity, any remaining cumulative unrealized loss resulting from the swap agreement would be recognized as a charge to "Remeasurement of 6.875% PEACS and other."
Income Taxes
- At June 30, 2003, we had net operating loss carryforwards (NOLs) of approximately $2.7 billion related to U.S. federal, state and foreign jurisdictions. Utilization of NOLs, which begin to expire at various times starting in 2010, may be subject to certain limitations. Approximately $1.3 billion of our NOLs relate to tax deductible stock-based compensation in excess of amounts recognized for financial reporting purposes—to the extent any of this amount is realized, the resulting benefit will be credited to stockholders' equity, rather than results of operations.
Net Loss
- Although we reported a $50 million improvement in our net loss, we believe that this improvement is not necessarily predictive of future trends for a variety of reasons. For example, we are unable to forecast the effect on our future reported results of certain items, including the stock-based compensation associated with variable accounting treatment and the gain or loss associated with the remeasurement of our 6.875% PEACS that results from fluctuations in foreign exchange rates. These items represented significant charges during the first and second quarters of 2003 and may result in significant charges or gains in future periods.
Cash Flows and Balance Sheet
- Operating cash flows and free cash flows can be volatile and are sensitive to many factors, including changes in working capital. Working capital at any specific point in time is subject to many variables, including world events, seasonality, the timing of expense payments, discounts offered by vendors, and vendor payment terms. For example, our second quarter 2003 trailing twelve month operating cash flow and free cash flow were positively impacted by approximately $20 million because, as previously reported, a credit card service provider unintentionally failed to make a scheduled quarter-end payment to us until the third quarter 2002, and in the second quarter 2003 we purchased and received customer payment for over 1.4 million units of Harry Potter and the Order of the Phoenix, for which payment was generally not due to our vendors until after the second quarter of 2003.
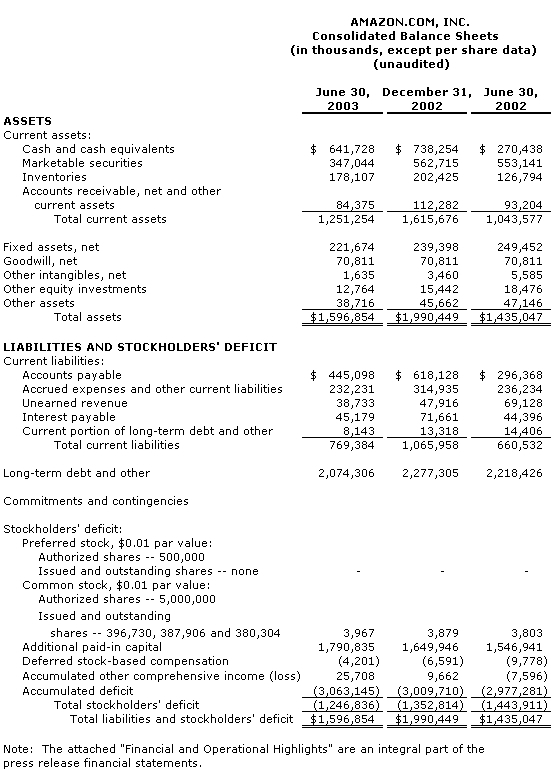
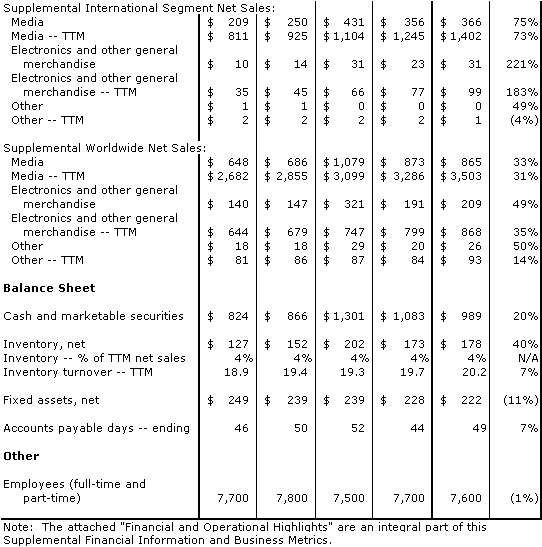
- Our cash, cash equivalents and marketable securities of $989 million are estimated fair value and primarily consist of cash, commercial paper and short-term obligations, U.S. Treasury notes and bonds and asset-backed and agency securities.
- We have pledged approximately $104 million of our marketable securities as collateral for property leases and other contractual obligations, compared with $124 million at June 30, 2002.
Long-term debt primarily includes the following (in millions):
| Principal
at Maturity | Interest Rate | Principal
Due Date | | | | | | | Convertible Subordinated Notes......... | $1,250 (1) | 4.750% | February 2009 | | PEACS.......................................... | 792 (2) | 6.875% | February 2010 | | | $2,042 |
—————————
(1) Convertible at the holders' option into our common stock at $78.0275 per share. We have the right to redeem the Convertible Subordinated Notes, in whole or in part, at a redemption price of 102.85% of the principal, which decreases to 100% over time, plus any unaccrued and unpaid interest.
(2) €690 million principal amount, convertible at the holders' option into our common stock at €84.883 per share. The U.S. Dollar equivalent principal, interest, and conversion price fluctuates based on the Euro/U.S. Dollar exchange ratio. We have the right to redeem the PEACS, in whole or in part, by paying the €690 million, plus any accrued and unpaid interest. Because we have terminated our cross-currency swap agreement relating to the PEACS, we have additional interest expense exposure to fluctuations in the Euro/US dollar exchange ratio.
Certain Definitions and Other
- We present segment information along two lines: North America and International. We measure operating results of our segments using an internal performance measure of direct segment operating expenses that exclude stock-based compensation, amortization of goodwill and other intangibles, and restructuring-related and other charges, each of which is not allocated to segment results. All other centrally-incurred operating costs are fully allocated to segment results. Our operating results, particularly for the International segment, are affected by movements in foreign exchange rates.
- The North America segment consists of amounts earned from retail sales of consumer products through www.amazon.com and www.amazon.ca (including from third-party sellers), from North America focused Syndicated Stores, such as www.cdnow.com, and mail-order catalogs and from non-retail activities such as North America focused Merchant.com, marketing and promotional agreements.
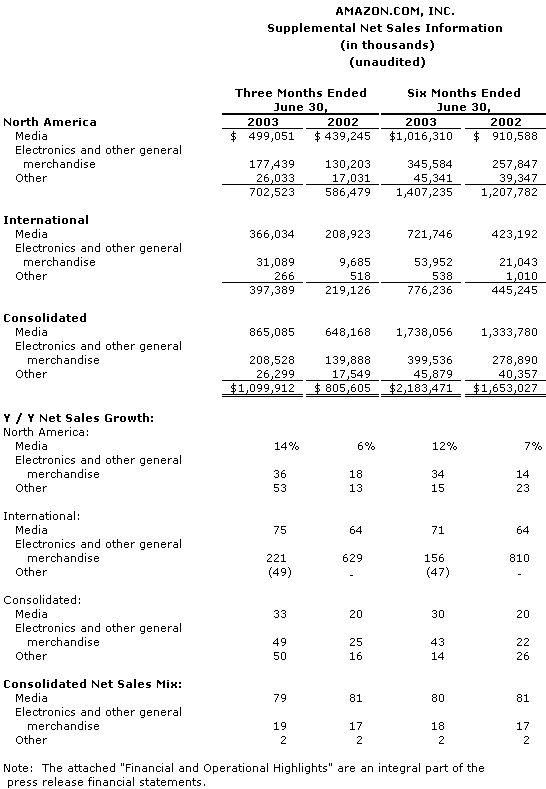
- The International segment consists of amounts earned from retail sales of consumer products through www.amazon.co.uk, www.amazon.de, www.amazon.fr and www.amazon.co.jp (including from third-party sellers), from internationally focused Syndicated Stores and from non-retail activities such as internationally focused marketing and promotional agreements. This segment includes export sales from www.amazon.co.uk, www.amazon.de, www.amazon.fr and www.amazon.co.jp (including export sales from these sites to customers in the U.S. and Canada), but excludes export sales from www.amazon.com and www.amazon.ca. We have also provided supplemental revenue information within each segment for three categories: "Media," "Electronics and other general merchandise" and "Other." Media consists of amounts earned from retail sales from all sellers of books, music, DVD/video, magazine subscriptions, software and video games. Electronics and other general merchandise consists of amounts earned from retail sales from all sellers of items not included in Media, such as electronics, toys, home improvement, home and garden, and apparel. The Other category consists of non-retail activities, such as the Merchant.com program and miscellaneous marketing and promotional activities.
- All references to customers mean customer accounts, which are unique e-mail addresses, established either when a customer's initial order is shipped or when a customer orders from certain third-party sellers on our Web sites. Customer accounts include customers of Amazon Marketplace, Auctions and zShops and our Merchants@ and Syndicated Stores Programs, but exclude Merchant.com Program customers, Amazon.com Payments customers, our catalog customers and the customers of select companies with whom we have a technology alliance or marketing and promotional relationships. A customer is considered active upon placing an order.
- All references to units mean units sold (net of returns and cancellations) by us and third-party sellers at Amazon.com domains worldwide—such as www.amazon.com, www.amazon.ca, www.amazon.fr, www.amazon.co.uk, www.amazon.de and www.amazon.co.jp—and at Syndicated Stores domains, as well as Amazon.com-owned items sold at non-Amazon.com domains, such as books, music and DVD/video items ordered from Amazon.com's store at www.target.com. Units do not include Amazon.com gift certificates.
|