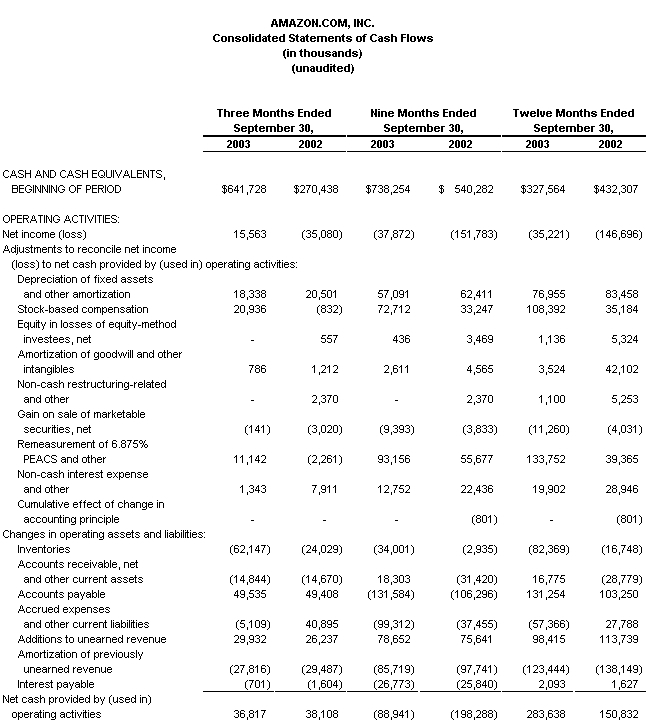
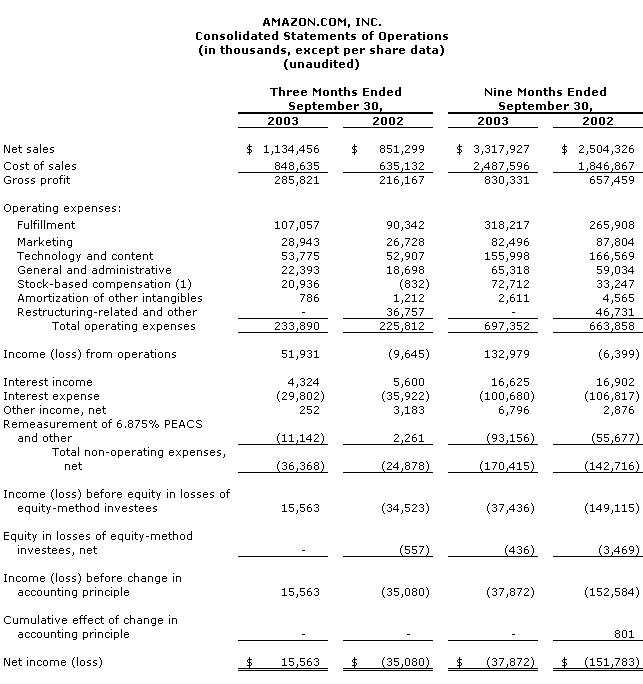
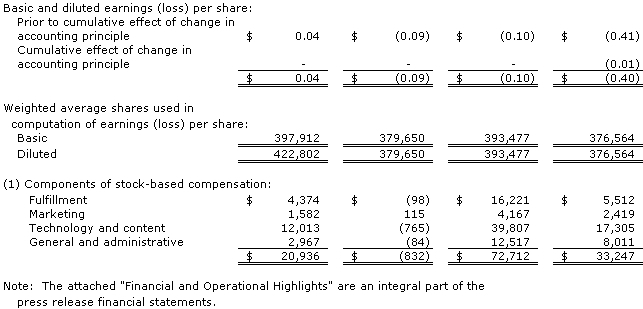
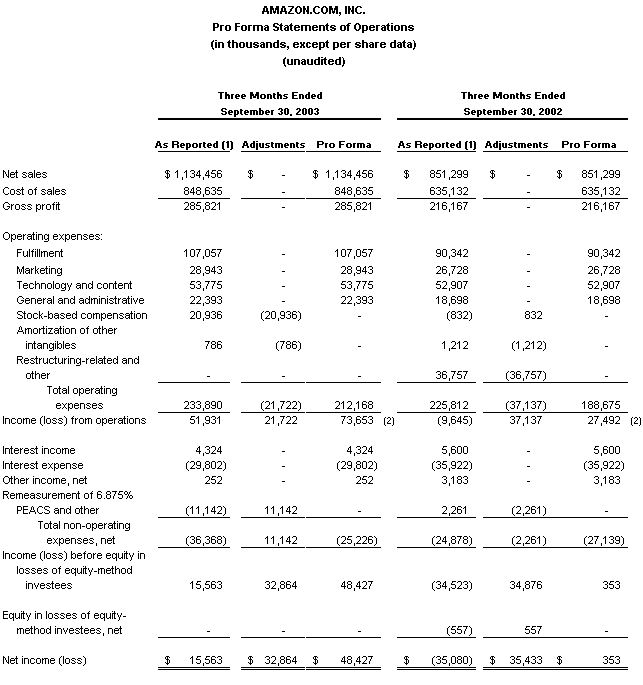
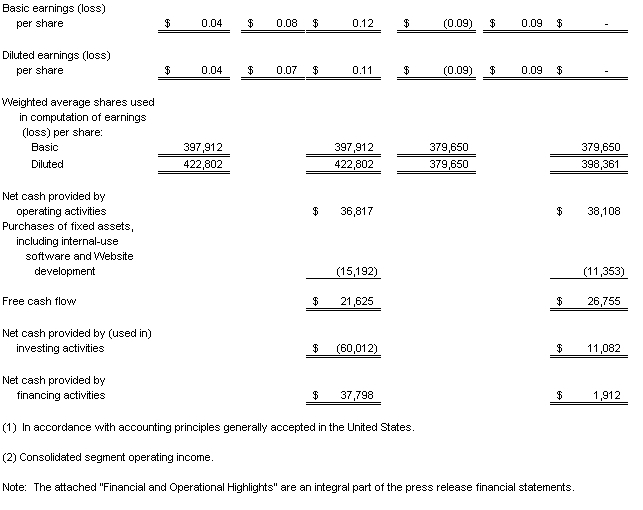
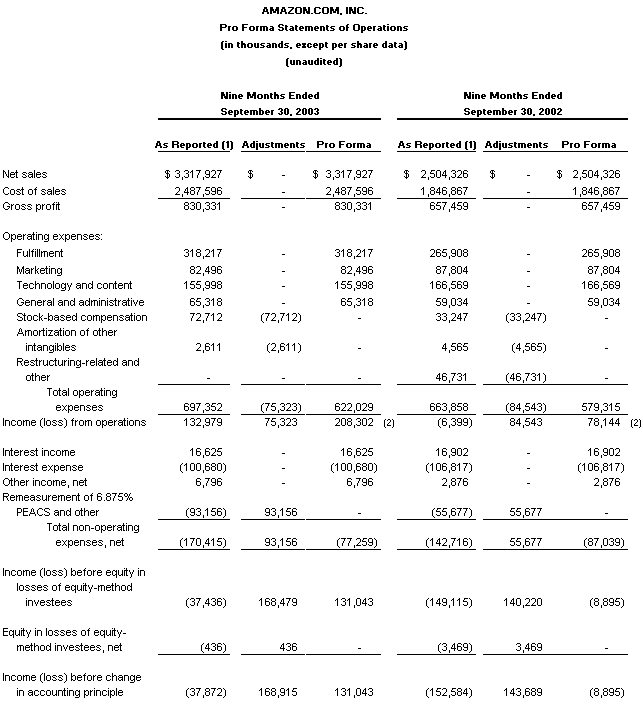
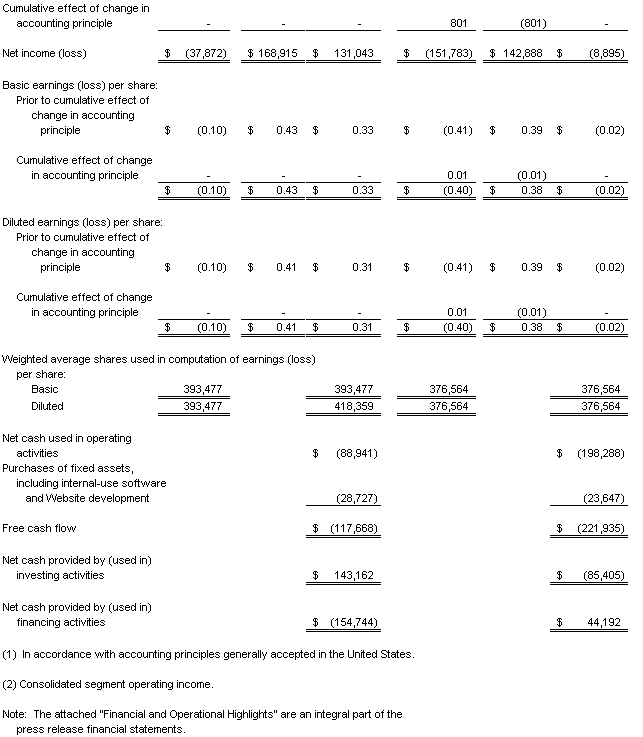
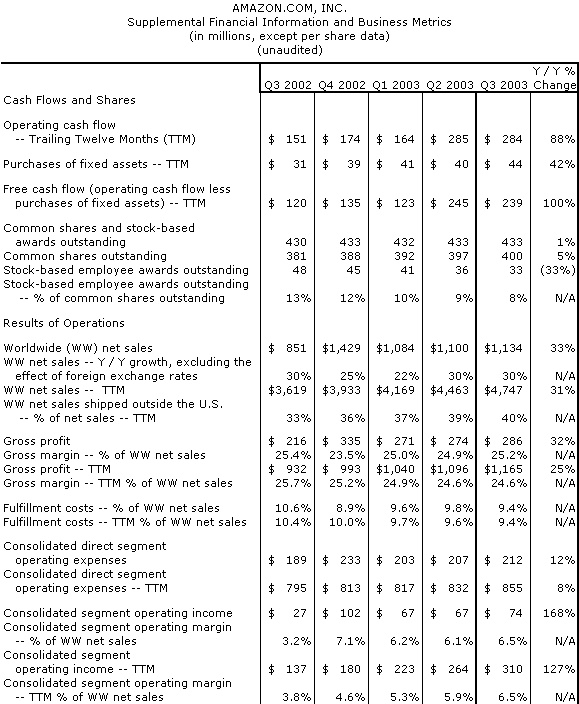
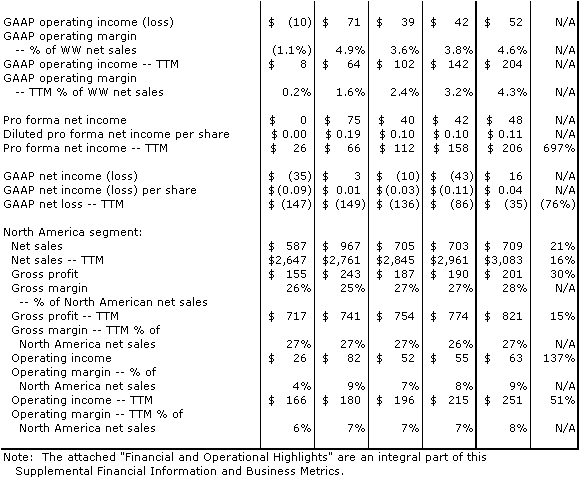
AMAZON.COM ANNOUNCES THIRD-QUARTER FINANCIAL RESULTS; EXPECTS RECORD HOLIDAY SHOPPING SEASONSEATTLE—(BUSINESS WIRE)—October 21, 2003—Amazon.com, Inc. (NASDAQ: AMZN) today announced financial results for its third quarter ended September 30, 2003. Operating cash flow was $284 million for the trailing twelve months, compared with $151 million for the trailing twelve months ended September 30, 2002. Free cash flow was $239 million for the trailing twelve months, compared with $120 million for the trailing twelve months ended September 30, 2002. Common shares outstanding plus shares underlying stock-based employee awards totaled 433 million at September 30, 2003, an increase of 1% compared with a year ago. Net sales were $1.13 billion in the third quarter, compared with $851 million in third quarter 2002, an increase of 33%. Net sales benefited by $29 million from changes in foreign exchange rates compared with third quarter 2002. Operating income was $52 million in the third quarter, or 5% of net sales, compared with an operating loss of $10 million in third quarter 2002. Consolidated segment operating income improved $46 million to $74 million, or 6% of net sales, compared with $27 million, or 3% of net sales, in third quarter 2002. Net income was $16 million in the third quarter, or $0.04 per diluted share, compared with a net loss of $35 million, or $0.09 per share, in third quarter 2002. Pro forma net income in the third quarter grew to $48 million, or $0.11 per diluted share, compared with $0 million, or $0.00 per diluted share, in third quarter 2002. "Thanks to free shipping and low prices, we expect more customers to turn to us for their holiday gifting needs this year—producing our biggest holiday shopping season ever," said Jeff Bezos, Amazon.com founder and CEO. The Company currently offers Free Super Saver Shipping on orders over $25 at www.amazon.com and free shipping options at its U.K., German, French, Japanese and Canadian sites. Amazon.com also offers 30% off books over $15 and continues to lower prices every day across its product offerings including electronics, tools and bestselling CDs and DVDs. To encourage customers to try its newest stores, the Company is currently offering promotional discounts in apparel and sporting goods. See "Financial Measures" for additional information. Quarterly Highlights
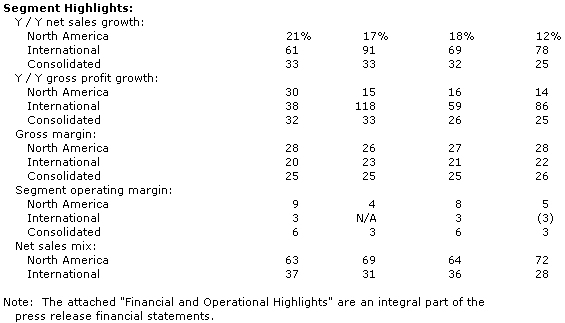
- Worldwide unit growth was 36% compared with third quarter 2002.
- Third-party seller units (new, used and refurbished items sold on the Company's Websites by businesses and individuals) grew to 22% of worldwide units in the third quarter, compared with 17% of units a year ago.
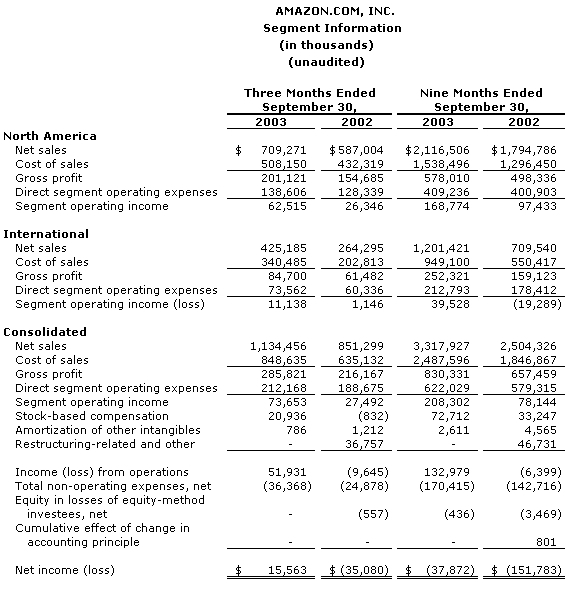
- North America segment sales, representing the Company's U.S. and Canadian sites, grew 21% to $709 million in the third quarter and segment operating income grew 137% to $63 million, or 9% of net sales compared with third quarter 2002.
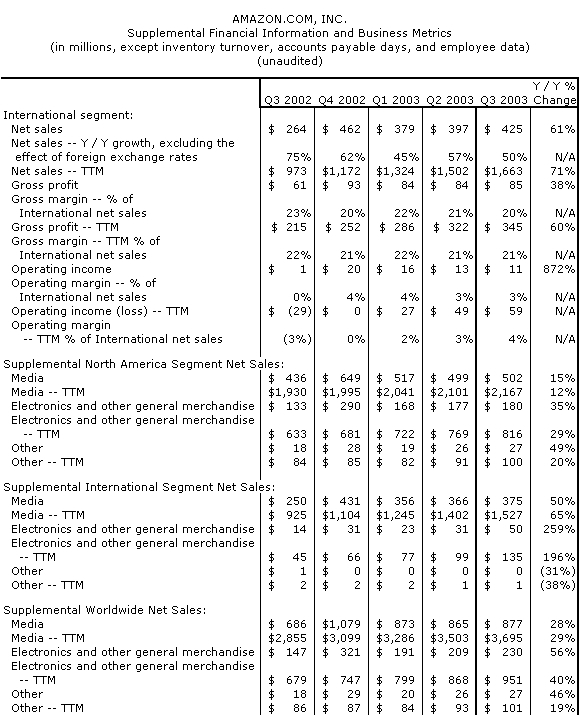
- International segment sales, representing the Company's U.K., German, French and Japanese sites, grew 61% to $425 million in the third quarter and benefited by $28 million from changes in foreign exchange rates compared with third quarter 2002. International segment operating income was $11 million, or 3% of net sales.
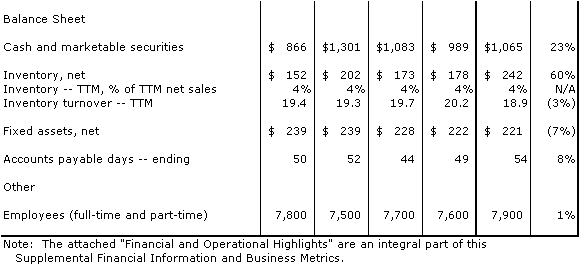
- Inventory turns for the trailing twelve months were 19, consistent with a year ago.
- The Company expanded selection by launching a sporting goods store in the U.S. and an electronics store in Japan.
Financial Guidance The following forward-looking statements reflect Amazon.com's expectations as of October 21, 2003. Results may be materially affected by many factors, such as fluctuations in foreign exchange rates, changes in global economic conditions and consumer spending, world events, the emerging nature and rate of growth of the Internet and online commerce, and the various factors detailed below. Fourth Quarter 2003 Guidance
- Fourth quarter net sales are expected to be between $1.76 billion and $1.91 billion, or grow between 23% and 34%, compared with fourth quarter 2002.
- Consolidated segment operating income is expected to be between $125 million and $155 million.
- Operating income is expected to be between $110 million and $140 million, assuming, among other things, that the Company does not record any revisions to its restructuring-related estimates and that the closing price of Amazon.com common stock on December 31, 2003 is identical to the closing price of $48.43 on September 30, 2003.
Full Year 2004 Expectations
- Net sales are expected to be between $5.75 billion and $6.25 billion.
- Consolidated segment operating income is expected to be between $375 million and $475 million.
- Operating income is expected to be between $315 million and $415 million, assuming, among other things, that the Company does not record any revisions to its restructuring-related estimates and that the closing price of Amazon.com common stock on December 31, 2003 and December 31, 2004 is identical to the closing price of $48.43 on September 30, 2003.
A conference call will be Webcast live today at 2 p.m. PT/5 p.m. ET and will be available at least through December 31, 2003, at www.amazon.com/ir. This call will contain forward-looking statements and other material information regarding the Company's financial and operating results. These forward-looking statements are inherently difficult to predict. Actual results could differ materially for a variety of reasons, including, in addition to the factors discussed above, the amount that Amazon.com invests in new business opportunities and the timing of those investments; the mix of products sold to customers; the mix of net sales derived from products as compared with services; competition; risks of inventory management; the degree to which the Company enters into, maintains and develops commercial agreements and strategic transactions; seasonality; international growth and expansion; and risks of fulfillment throughput and productivity. Other risks and uncertainties include, among others, risk of future losses, significant amount of indebtedness, potential fluctuations in operating results, management of potential growth, system interruptions, consumer trends, fulfillment center optimization, limited operating history, government regulation and taxation, fraud and new business areas. More information about factors that potentially could affect Amazon.com's financial results is included in Amazon.com's filings with the Securities and Exchange Commission, including its Annual Report on Form 10-K for the year ended December 31, 2002, and all subsequent filings. Financial Measures The following measures are defined by the Securities and Exchange Commission as non-GAAP financial measures. Free Cash Flow Operating cash flow is net cash provided by (used in) operating activities, including cash outflows for interest and excluding proceeds from the exercise of stock-based employee awards. Free cash flow is operating cash flow less cash outflows for purchases of fixed assets including internal-use software and Website development. A tabular reconciliation of differences from the comparable GAAP measure—operating cash flow—is included in the attached "Supplemental Financial Information and Business Metrics." Consolidated Segment Operating Income Consolidated segment operating income is the sum of segment operating income of our individual segments and excludes the following line items on the Company's statements of operations:
- Stock-based compensation,
- Amortization of other intangibles, and
- Restructuring-related and other.
A tabular reconciliation of differences from the comparable GAAP measure—operating income (loss)—is included in the attached "Pro Forma Statements of Operations." Pro Forma Net Income Pro forma net income excludes the following line items on the Company's statements of operations:
- Stock-based compensation,
- Amortization of other intangibles,
- Restructuring-related and other,
- Remeasurement of 6.875% PEACS and other,
- Equity in losses of equity-method investees, net, and
- Cumulative effect of change in accounting principle.
A tabular reconciliation of differences from the comparable GAAP measure—net income (loss)—is included in the attached "Pro Forma Statements of Operations." For additional information regarding these non-GAAP financial measures, see exhibit 99.2 to our Form 8-K filed contemporaneously with the issuance of this release. About Amazon.com Amazon.com, a Fortune 500 company based in Seattle, opened on the World Wide Web in July 1995 and today offers Earth's Biggest Selection. Amazon.com seeks to be Earth's most customer-centric company, where customers can find and discover anything they might want to buy online, and endeavors to offer its customers the lowest possible prices. Amazon.com and other sellers list millions of unique new and used items in categories such as sporting goods, apparel and accessories, books, music, DVDs, electronics and office, kids and baby and home and garden. Amazon.com operates six Websites: www.amazon.com, www.amazon.co.uk, www.amazon.de, www.amazon.fr, www.amazon.co.jp and www.amazon.ca.
|
AMAZON.COM, INC.
Financial and Operational Highlights
(unaudited) Third Quarter 2003 Results of Operations (comparisons are with the equivalent period of the prior year, unless otherwise stated) Net Sales
- Shipping revenue, which excludes amounts earned from third-party sellers, was approximately $77 million, up 5% from $73 million.
- Worldwide unit growth was 36%, compared with 41% in second quarter 2003, and third-party units as a percentage of worldwide units were 22%, compared with 19% in second quarter 2003.
Gross Profit
- Gross profit benefited by approximately $6 million, and consolidated segment operating income by approximately $1 million, from changes in foreign exchange rates compared with third quarter 2002.
- Shipping loss was approximately $27 million, up from a loss of $10 million. We continue to measure our shipping results relative to their effect on our overall financial results and intend to continue providing our customers with free shipping offers.
Fulfillment
- Fulfillment costs represent those costs incurred in operating and staffing our fulfillment and customer service centers, credit card fees and bad debt costs, including costs associated with our guarantee for certain third-party seller transactions. Fulfillment costs also include amounts paid to third-parties, who assist us in fulfillment and customer service operations.
- Certain of our fulfillment-related costs incurred on behalf of other businesses, such as Toysrus.com and Target, are classified as cost of sales rather than fulfillment.
- Credit card fees associated with third-party seller transactions represent a significant percentage relative to commission amounts earned, and as a result, negatively affect fulfillment as a percentage of net sales.
Stock-Based Compensation
Restructuring-Related and Other
- In first quarter 2001 we announced and began implementation of our operational restructuring plan. The restructuring is complete; however, we may adjust our restructuring-related estimates in the future, if necessary.
- Cash payments resulting from our operational restructuring were $3 million, compared with $8 million in third quarter 2002.
- We estimate, based on currently available information, the remaining net cash outflows associated with restructuring-related leases and other commitments will be $2 million in the remainder of 2003, $11 million in 2004, and $20 million thereafter. Amounts due within 12 months are included within "Accrued expenses and other current liabilities" and the remaining amounts within "Long-term debt and other" on our balance sheet. These amounts are net of anticipated sublease income of approximately $45 million (we have signed sublease agreements on $15 million in future income) on gross lease and other obligations of $79 million.
Remeasurement of 6.875% PEACS and Other
- "Remeasurement of 6.875% PEACS and other" primarily consisted of foreign-currency losses on remeasurement of 6.875% PEACS from Euros to U.S. Dollars of $12 million, compared with $0 million in third quarter 2002.
- Other includes a $2 million gain on sale of our mail order toy catalog business, for $5 million in cash.
Income Taxes
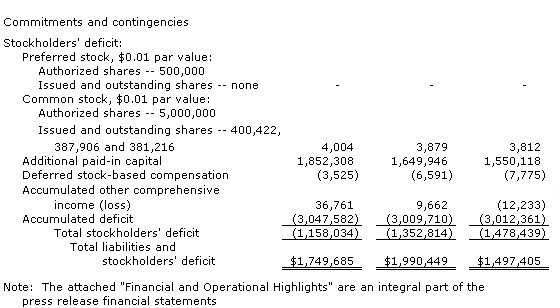
- At September 30, 2003, we had net operating loss carryforwards (NOLs) of approximately $2.9 billion related to U.S. federal, state and foreign jurisdictions. Utilization of NOLs, which begin to expire at various times starting in 2010, may be subject to certain limitations. Approximately $1.6 billion of our NOLs relate to tax deductible stock-based compensation in excess of amounts recognized for financial reporting purposes—to the extent that any of this amount is realized for tax purposes but not financial reporting purposes, the resulting benefit will be credited to stockholders' equity, rather than results of operations.
Net Income (Loss)
- Although we reported net income for third quarter of 2003, we believe that this positive net income result should not be viewed as a material positive event and is not predictive of future trends for a variety of reasons. For example, we are unable to forecast the effect on our future reported results of certain items, including the stock-based compensation associated with variable accounting treatment and the gain or loss associated with the remeasurement of our 6.875% PEACS that results from fluctuations in foreign exchange. These items represented significant charges during the first, second and third quarters of 2003 and may result in significant charges or gains in future periods.
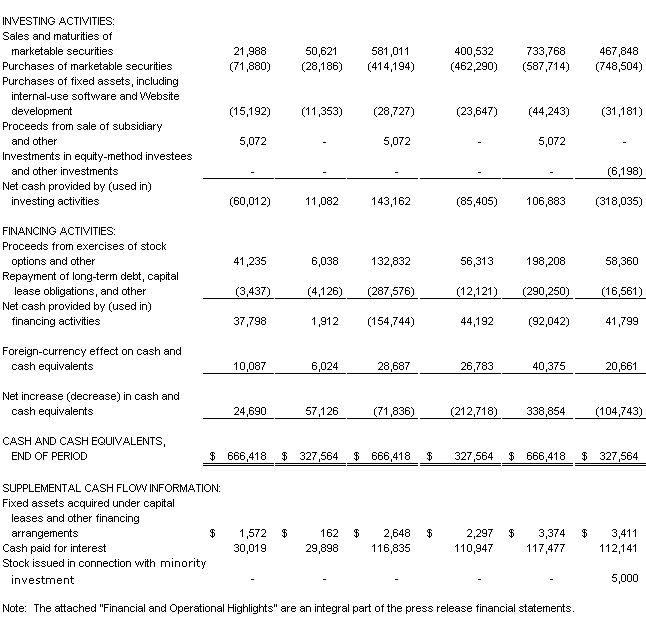
Cash Flows and Balance Sheet
- Operating cash flows and free cash flows can be volatile and are sensitive to many factors, including changes in working capital. Working capital at any specific point in time is subject to many variables, including world events, seasonality, the timing of expense payments, discounts offered by vendors, and vendor payment terms.
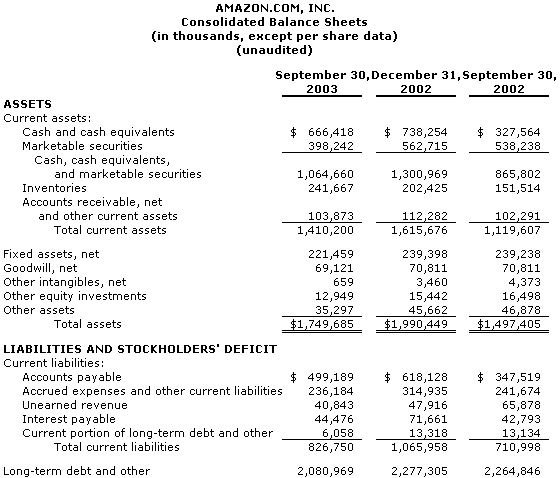
- Our cash, cash equivalents and marketable securities of $1.1 billion, at fair value, primarily consist of cash, commercial paper and short-term securities, U.S. Treasury notes and bonds and asset-backed and agency securities.
- We have pledged approximately $106 million of our marketable securities as collateral for property leases and other contractual obligations, compared with $135 million at September 30, 2002.
- "Unearned revenue" includes amounts received from third parties in advance of us providing the associated service.
- "Accrued expenses and other current liabilities" includes, among other things, liabilities for gift certificates, marketing activities, and workforce costs, including accrued payroll, vacation, and other benefits.
- "Long-term debt and other" primarily includes the following (in millions):
| Principal
at Maturity | Interest Rate | Principal
Due Date | | | | | | | Convertible Subordinated Notes........ | $1,250 (1) | 4.750% |
February 2009
| | PEACS......................................... | 805 (2) | 6.875% | February 2010 | | | $2,055(3) | | |
___________
(1) Convertible at the holders' option into our common stock at $78.0275 per share. We have the right to redeem the Convertible Subordinated Notes, in whole or in part, at a redemption price of 102.85% of the principal, which decreases to 100% over time, plus any accrued and unpaid interest.
(2) €690 million principal amount, convertible at the holders' option into our common stock at €84.883 per share. The U.S. Dollar equivalent principal, interest, and conversion price fluctuates based on the Euro/U.S. Dollar exchange ratio. We have the right to redeem the PEACS, in whole or in part, by paying the €690 million, plus any accrued and unpaid interest. Because we do not hedge any portion of the PEACS, we have interest expense exposure to fluctuations in the Euro/US dollar exchange ratio.
(3) The "if converted" number of shares associated with each of our convertible debt instruments (approximately 24 million total shares) are excluded from diluted shares as their effect is anti-dilutive.
Certain Definitions and Other
- We present segment information along two lines: North America and International. We measure operating results of our segments using an internal performance measure of direct segment operating expenses that excludes stock-based compensation, amortization of goodwill and other intangibles, and restructuring-related and other charges, each of which is not allocated to segment results. All other centrally-incurred operating costs are fully allocated to segment results. Our operating results, particularly for the International segment, are affected by movements in foreign exchange rates.
- The North America segment consists of amounts earned from retail sales of consumer products through www.amazon.com and www.amazon.ca (including from third-party sellers), from North America focused Syndicated Stores, such as www.cdnow.com, mail-order catalogs and from non-retail activities such as North America focused Merchant.com, marketing and promotional agreements.
- The International segment consists of amounts earned from retail sales of consumer products through www.amazon.co.uk, www.amazon.de, www.amazon.fr and www.amazon.co.jp (including from third-party sellers), from internationally focused Syndicated Stores and from non-retail activities such as internationally focused marketing and promotional agreements. This segment includes export sales from www.amazon.co.uk, www.amazon.de, www.amazon.fr and www.amazon.co.jp (including export sales from these sites to customers in the U.S. and Canada), but excludes export sales from www.amazon.com and www.amazon.ca.
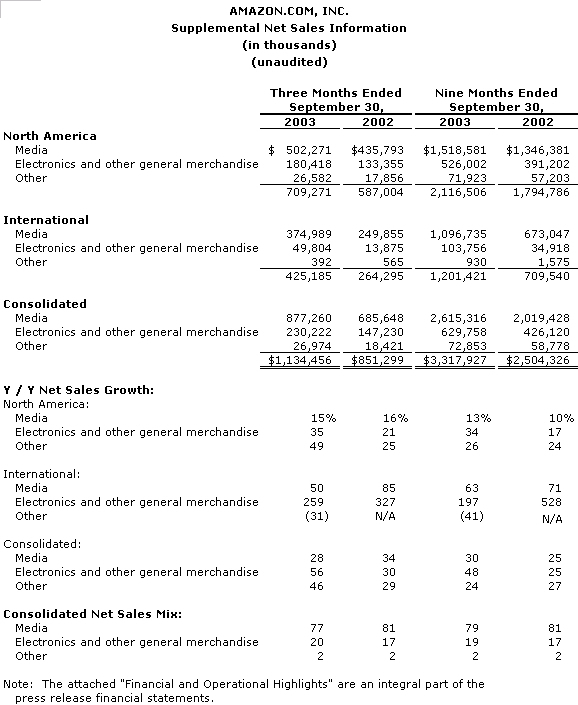
- We provide supplemental revenue information within each segment for three categories: "Media," "Electronics and other general merchandise" and "Other." Media consists of amounts earned from retail sales from all sellers of books, music, DVD/video, magazine subscriptions, software, video games and video game consoles. Electronics and other general merchandise consists of amounts earned from retail sales from all sellers of items not included in Media, such as electronics and office, kids and baby, home and garden, apparel and sporting goods. The Other category consists of non-retail activities, such as the Merchant.com program and miscellaneous marketing and promotional activities.
- All references to customers mean customer accounts, which are unique e-mail addresses, established either when a customer's initial order is shipped or when a customer orders from certain third-party sellers on our Websites. Customer accounts include customers of Amazon Marketplace, Auctions and zShops and our Merchants@ and Syndicated Stores Programs, but exclude Merchant.com Program customers, Amazon.com Payments customers, our catalog customers and the customers of select companies with whom we have a technology alliance or marketing and promotional relationships. A customer is considered active upon placing an order.
- All references to units mean units sold (net of returns and cancellations) by us and third-party sellers at Amazon.com domains worldwide—such as www.amazon.com, www.amazon.ca, www.amazon.fr, www.amazon.co.uk, www.amazon.de and www.amazon.co.jp—and at Syndicated Stores domains, as well as Amazon.com-owned items sold at non-Amazon.com domains, such as books, music and DVD/video items ordered from Amazon.com's store at www.target.com. Units do not include Amazon.com gift certificates.
|